UNITED STATES
SECURITIES AND EXCHANGE COMMISSION
Washington, D.C. 20549
Form 10-K
| (Mark One) | |||||
ANNUAL REPORT PURSUANT TO SECTION 13 OR 15(d) OF THE SECURITIES EXCHANGE ACT OF 1934 FOR THE FISCAL YEAR ENDED | |||||
| OR | |||||
| TRANSITION REPORT PURSUANT TO SECTION 13 OR 15(d) OF THE SECURITIES EXCHANGE ACT OF 1934 | |||||
| FOR THE TRANSITION PERIOD FROM TO | |||||
Commission file number: 001-35826
(Exact name of registrant as specified in its charter)
(State or other jurisdiction of incorporation or organization) | (I.R.S. Employer Identification No.) | ||||
| (Address of principal executive offices) | (Zip Code) | ||||
(414 ) 390-6100
(Registrant’s telephone number, including area code)
Securities registered pursuant to Section 12(b) of the Act:
| (Title of each class) | (Trading Symbol) | (Name of each exchange on which registered) | ||||||
Securities registered pursuant to section 12(g) of the Act: None
Indicate by check mark if the registrant is a well-known seasoned issuer, as defined in Rule 405 of the Securities Act. Yes þ No o
Indicate by check mark if the registrant is not required to file reports pursuant to Section 13 or 15(d) of the Act. Yes o No þ
Indicate by check mark whether the registrant: (1) has filed all reports required to be filed by Section 13 or 15(d) of the Securities Exchange Act of 1934 during the preceding 12 months (or for such shorter period that the registrant was required to file such reports), and (2) has been subject to such filing requirements for the past 90 days. Yes þ No o
Indicate by check mark whether the registrant has submitted electronically every Interactive Data File required to be submitted pursuant to Rule 405 of Regulation S-T (§ 232.405 of this chapter) during the preceding 12 months (or for such shorter period that the registrant was required to submit such files). Yes þ No o
Indicate by check mark whether the registrant is a large accelerated filer, an accelerated filer, a non-accelerated filer, a smaller reporting company, or an emerging growth company. See the definitions of “large accelerated filer,” “accelerated filer”, “smaller reporting company” and “emerging growth company” in Rule 12b-2 of the Exchange Act.
Accelerated filer o | |||||||||||
Non-accelerated filer o | Smaller reporting company | ||||||||||
Emerging growth company | |||||||||||
If an emerging growth company, indicate by check mark if the registrant has elected not to use the extended transition period for complying with any new or revised financial accounting standards provided pursuant to Section 13(a) of the Exchange Act. o
Indicate by check mark whether the registrant has filed a report on and attestation to its management’s assessment of the effectiveness of its internal control over financial reporting under Section 404(b) of the Sarbanes-Oxley Act (15 U.S.C. 7262(b)) by the registered public accounting firm that prepared or issued its audit report. ☑
If securities are registered pursuant to Section 12(b) of the Act, indicate by check mark whether the financial statements of the registrant included in the filing reflect the correction of an error to previously issued financial statements. ☐
Indicate by check mark whether any of those error corrections are restatements that required a recovery analysis of incentive-based compensation received by any of the registrant's executive officers during the relevant recovery period pursuant to §240.10D-1(b). ☐
Indicate by check mark whether the registrant is a shell company (as defined in Rule 12b-2 of the Exchange Act). Yes ☐ No þ
The aggregate market value of common equity held by non-affiliates of the registrant at June 30, 2025, which was the last business day of the registrant’s most recently completed second fiscal quarter, was approximately $3.1 billion based on the closing price of $44.33 for the Class A common stock, as reported on the New York Stock Exchange on that date.
For purposes of this calculation only, it is assumed that the affiliates of the registrant include only directors and executive officers of the registrant.
The number of outstanding shares of the registrant’s Class A common stock, par value $0.01 per share, Class B common stock, par value $0.01 per share and Class C common stock, par value $0.01 per share, as of February 19, 2026 were 70,530,755 , 1,137,929 and 8,917,476 , respectively.
DOCUMENTS INCORPORATED BY REFERENCE
Certain portions of the registrant’s definitive proxy statement for its annual meeting of stockholders, to be filed with the Securities and Exchange Commission within 120 days after December 31, 2025, are incorporated by reference into Part III of this Form 10-K.
TABLE OF CONTENTS
| Page | ||||||||
| PART I | ||||||||
| Item 1. | ||||||||
| Item 1A. | ||||||||
| Item 1B. | ||||||||
| Item 1C. | ||||||||
| Item 2. | ||||||||
| Item 3. | ||||||||
| Item 4. | ||||||||
| PART II | ||||||||
| Item 5. | ||||||||
| Item 6. | ||||||||
| Item 7. | ||||||||
| Item 7A. | ||||||||
| Item 8. | ||||||||
| Item 9. | ||||||||
| Item 9A. | ||||||||
| Item 9B. | ||||||||
| Item 9C. | ||||||||
| PART III | ||||||||
| Item 10. | ||||||||
| Item 11. | ||||||||
| Item 12. | ||||||||
| Item 13. | ||||||||
| Item 14. | ||||||||
| PART IV | ||||||||
| Item 15. | ||||||||
| Item 16. | ||||||||
Except where the context requires otherwise, in this report:
•“Artisan Funds” refers to each series of Artisan Partners Funds, Inc., an open-ended management investment company, registered with the Securities and Exchange Commission.
•“Artisan Global Funds” refers to each sub-fund of Artisan Partners Global Funds plc, an open-ended investment company registered with the Central Bank of Ireland pursuant to the European UCITS Directive.
•“Artisan Private Funds” refers to private investment funds sponsored by Artisan.
•“Client” and “clients” refer to investors who access our investment management services by investing in funds, including Artisan Funds, Artisan Global Funds, Artisan Private Funds or other pooled investment vehicles (including collective investment trusts) for which we serve as investment adviser, or by engaging us to manage a separate account or provide a non-discretionary model portfolio in one or more of our investment strategies.
•“Company”, “Artisan”, “we”, “us” or “our” refer to Artisan Partners Asset Management Inc. (“APAM”) and its direct and indirect subsidiaries, including Artisan Partners Holdings LP (“Artisan Partners Holdings” or “Holdings”), and, for periods prior to our IPO, “Artisan,” the “company,” “we,” “us” and “our” refer to Artisan Partners Holdings and, unless the context otherwise requires, its direct and indirect subsidiaries. On March 12, 2013, APAM closed its IPO and related IPO Reorganization. Prior to that date, APAM was a subsidiary of Artisan Partners Holdings. The IPO Reorganization and IPO are described in the notes to our consolidated financial statements included in Part II of this Form 10-K.
•“IPO” means the initial public offering of 12,712,279 shares of Class A common stock of Artisan Partners Asset Management Inc. completed on March 12, 2013.
•“IPO Reorganization” means the series of transactions Artisan Partners Asset Management Inc. and Artisan Partners Holdings completed on March 12, 2013, immediately prior to the IPO, in order to reorganize their capital structures in preparation for the IPO.
i
Forward-Looking Statements
This report contains, and from time to time our management may make, forward-looking statements within the meaning of the safe harbor provisions of the U.S. Private Securities Litigation Reform Act of 1995. Statements regarding future events and our future performance, as well as management’s current expectations, beliefs, plans, estimates or projections relating to the future, are forward-looking statements within the meaning of these laws. In some cases, you can identify these statements by forward-looking words such as “may”, “might”, “will”, “should”, “expects”, “intends”, “plans”, “anticipates”, “believes”, “estimates”, “predicts”, “potential” or “continue”, the negative of these terms and other comparable terminology. Forward-looking statements are only predictions based on current expectations of our management and information available to us at the time such statements are made. Forward-looking statements are subject to a number of risks and uncertainties, and there are important factors that could cause actual results, level of activity, performance, actions or achievements to differ materially from the results, level of activity, performance, actions or achievements expressed or implied by the forward-looking statements. These factors include: the loss of key investment professionals or senior management, adverse market or economic conditions, poor performance of our investment strategies, significant changes in client cash inflows or outflows or declines in market value of the assets in the accounts we manage, change in the legislative and regulatory environment in which we operate, our ability to maintain our current fee rates, operational or technical errors or other damage to our reputation and other factors disclosed in the Company’s filings with the Securities and Exchange Commission, including those factors listed under the caption entitled “Risk Factors” in Item 1A of this Form 10-K, as may be amended from time to time. We undertake no obligation to publicly update any forward-looking statements in order to reflect events or circumstances that may arise after the date of this report, except as required by law.
Forward-looking statements include, but are not limited to, statements about:
•our anticipated future results of operations;
•our potential operating performance and efficiency, including our ability to operate under different and unique circumstances;
•our expectations with respect to future business initiatives, including the development of new investment teams, strategies and vehicles;
•our expectations with respect to the performance of our investment strategies;
•our expectations with respect to future levels of AUM, including the capacity of our strategies and client cash inflows and outflows;
•our expectations with respect to industry trends and how those trends may impact our business;
•our financing plans, cash needs and liquidity position;
•our intention to pay dividends and our expectations about the amount of those dividends;
•our expected levels of compensation of our employees, including equity- and cash-based long-term incentive compensation;
•our expectations with respect to future expenses and the level of future expenses;
•our expected tax rate, and our expectations with respect to deferred tax assets; and
•our estimates of future amounts payable pursuant to our tax receivable agreements.
ii
Investment Performance, Client Cash Flows and Assets Under Management (AUM) Information Used in this Report
We manage investments primarily through pooled investment funds and separate accounts. We serve as investment adviser to Artisan Funds, Artisan Global Funds and Artisan Private Funds. We refer to funds and other accounts that are managed by us with a broadly common investment objective and substantially in accordance with a single model account as being part of the same investment “strategy”.
We measure investment performance based upon the results of our “composites”, which represent the aggregate performance of all discretionary client accounts (including pooled investment vehicles) invested in the same strategy, except for those accounts with respect to which we believe client-imposed investment restrictions may have a material impact on portfolio construction and those accounts managed in a currency other than U.S. dollars. The results of these excluded accounts, which represented approximately 18% of our AUM at December 31, 2025, are maintained in separate composites the results of which are not presented in this report.
The performance of accounts with client-imposed investment restrictions differs from the performance of accounts included in our principal composite for the applicable strategy because one or more securities may be omitted from the portfolio in order to comply with client restrictions and the weightings in the portfolio of other securities are typically correspondingly altered. The performance of non-U.S. dollar accounts differs from the performance of the principal composite for the applicable strategy because of the fluctuations in currency exchange rates between the currencies in which portfolio securities are traded and the currency in which the account is managed or U.S. dollars, respectively. Results for any investment strategy described herein, and for different investment vehicles within a strategy, are affected by numerous factors, including: different material market or economic conditions; different investment management fee rates, brokerage commissions and other expenses; and the reinvestment of dividends or other earnings. The returns for any strategy may be positive or negative, and past performance does not guarantee future results. In this report, we refer to the date on which we began tracking the performance of an investment strategy as the “inception date”.
Unless otherwise noted, we present the average annual returns of our composites on a “gross” basis, which represent average annual returns before payment of fees payable to us by any portfolio in the composite and net of commissions and transaction costs. An investor’s return in a portfolio would be lower than the gross results presented due to the deduction of applicable fees and expenses. We also present the average annual returns of certain market indices or “benchmarks” for the comparable period. The indices are unmanaged and have differing volatility, credit and other characteristics than our investment strategies. You should not assume that there is any material overlap between the securities included in the portfolios of our investment strategies during these periods and those that comprise any of the strategy’s comparator index in this report. At times, this causes material differences in relative performance. It is not possible to invest directly in any of the indices. The returns of these indices, as presented in this report, have not been reduced by fees and expenses associated with investing in securities, but do include the reinvestment of dividends.
In these materials, we present Value-Added, which is the difference, in basis points, between an Artisan strategy’s average annual gross return and the return of its respective benchmark. The benchmark used for purposes of presenting a strategy’s performance and calculating Value-Added is generally the market index most commonly used by our clients to compare the performance of the relevant strategy. For certain strategies that are managed for absolute return, the benchmark used for purposes of presenting a strategy’s performance and calculating Value-Added is the index used by the Company’s management to evaluate the performance of the strategy. Composites / Indexes used for the comparison calculations described are: Non-U.S. Growth Strategy / International Value Strategy-MSCI EAFE Index; Global Equity Strategy / Global Opportunities Strategy / Global Value Strategy / Franchise Strategy-MSCI All Country World Index; Global Discovery Strategy-MSCI All Country World Small Mid Cap Index; Non-U.S. Small-Mid Growth Strategy-MSCI All Country World Index Ex USA Small Mid Index; U.S. Mid-Cap Growth Strategy-Russell Midcap Growth® Index; U.S. Mid-Cap Value Strategy-Russell Midcap Value® Index; U.S. Small-Cap Growth Strategy-Russell 2000 Growth® Index; Value Equity Strategy-Russell 1000 Value® Index; Developing World Strategy / Sustainable Emerging Markets Strategy-MSCI Emerging Markets Index; High Income Strategy-ICE BofA U.S. High Yield Index; Credit Opportunities Strategy-ICE BofA U.S. Dollar 3-Month Deposit Offered Rate Constant Maturity Index; Antero Peak Strategy / Antero Peak Hedge Strategy / Select Equity Strategy / Value Income Strategy-S&P 500® Market Index; International Explorer Strategy-MSCI All Country World Index Ex USA Small Cap; Floating Rate Strategy-S&P UBS Leveraged Loan Index; Global Unconstrained Strategy-ICE BofA 3-Month U.S. Treasury Bill Index; Global Special Situations Strategy-ICE BofA Global High Yield Index; Emerging Markets Debt Opportunities Strategy-J.P. Morgan EMB Hard Currency/Local Currency 50-50; Emerging Markets Local Opportunities Strategy-J.P. Morgan GBI-EM Global Diversified Index. Where applicable, composite returns have been included for the following discontinued strategies and their indexes: Global Small-Cap Growth Strategy (Jul 1, 2013-Dec 31, 2016)-MSCI ACWI Small Cap Index; U.S. Small-Cap Value Strategy (Jun 1, 1997-Apr 30, 2016)-Russell 2000® Index; Non-U.S. Small-Cap Growth Strategy (Jan 1, 2002-Nov 30, 2018)-MSCI EAFE Small Cap Index; China Post-Venture Strategy (Apr 1, 2021-Jun 30, 2025)-MSCI China SMID Cap Index.
The MSCI indexes referenced herein are trademarks of MSCI Inc. MSCI makes no express or implied warranties or representations and shall have no liability whatsoever with respect to any MSCI data contained herein. The MSCI data may not be further redistributed or used to create indices or financial products. This report is not approved or produced by MSCI.
The Russell indexes referenced herein are trademarks of Russell Investment Group. Frank Russell Company (“Russell”) is the source and owner of the trademarks, service marks and copyrights related to the Russell Indexes. Russell® is a trademark of Frank Russell Company. Neither Russell nor its licensors accept any liability for any errors or omissions in the Russell Indexes and/or Russell ratings or underlying data and no party may rely on any Russell Indexes and/or Russell ratings and/or underlying data contained in this communication. No further distribution of Russell Data is permitted without Russell’s express written consent. Russell does not promote, sponsor or endorse the content of this communication.
The S&P indexes referenced herein are products of S&P Dow Jones Indices LLC (S&P DJI) and/or its affiliates and has been licensed for use. Copyright© 2025 S&P Dow Jones Indices LLC, a division of S&P Global, Inc. All rights reserved. Redistribution or reproduction in whole or in part are prohibited without written permission of S&P Dow Jones Indices LLC. S&P® is a registered trademark of S&P Global and Dow Jones® is a registered trademark of Dow Jones Trademark Holdings LLC (Dow Jones). None of S&P DJI, Dow Jones, their affiliates or third party licensors makes any representation or warranty, express or implied, as to the ability of any index to accurately represent the asset class or market sector that it purports to represent and none shall have any liability for any errors, omissions or interruptions of any index or the data included therein.
The ICE BofA indexes referenced herein are owned by ICE Data Indices, LLC, used with permission. Source ICE Data Indices, LLC is used with permission. ICE® is a registered trademark of ICE Data Indices, LLC or its affiliates and BofA® is a registered trademark of Bank of America
iii
Corporation licensed by Bank of America Corporation and its affiliates (“BofA”), and may not be used without BofA’s prior written approval. The index data referenced herein is the property of ICE Data Indices, LLC, its affiliates (“ICE Data”) and/or its third party suppliers and, along with the ICE BofA trademarks, has been licensed for use by Artisan Partners Limited Partnership. ICE Data and its third party suppliers accept no liability in connection with the use of such index data or marks.
The J.P. Morgan indexes referenced herein are trademarks of J.P. Morgan. Information has been obtained from sources believed to be reliable but J.P. Morgan does not warrant its completeness or accuracy. Indices are used with permission and may not be copied, used or distributed without J.P. Morgan's prior written approval. Copyright 2025, J.P. Morgan Chase & Co. All rights reserved.
In this report, we present ratings from Morningstar, Inc., for the series of Artisan Funds. The Morningstar RatingTM for funds, or “star rating” is calculated for managed products (including mutual funds, variable annuity and variable life subaccounts, exchange-traded funds, closed-end funds and separate accounts) with at least a three-year history. Exchange-traded funds and open-ended mutual funds are considered a single population for comparative purposes. It is calculated based on a Morningstar Risk-Adjusted Return measure that accounts for variation in a managed product's monthly excess performance, placing more emphasis on downward variations and rewarding consistent performance. The top 10% of products in each product category receive 5 stars, the next 22.5% receive 4 stars, the next 35% receive 3 stars, the next 22.5% receive 2 stars, and the bottom 10% receive 1 star. The Overall Morningstar Rating for a managed product is derived from a weighted average of the performance figures associated with its three-, five-, and 10-year (if applicable) Morningstar Rating metrics. The weights are: 100% three-year rating for 36-59 months of total returns, 60% five-year rating/40% three-year rating for 60-119 months of total returns, and 50% 10-year rating/30% five-year rating/20% three-year rating for 120 or more months of total returns. While the 10-year overall star rating formula seems to give the most weight to the 10-year period, the most recent three-year period actually has the greatest impact because it is included in all three rating periods. The ratings which form the basis for the information reflected in this report, and the fund categories in which they are rated, relating to each Fund's Investor Share Class are: Artisan Developing World Fund—Diversified Emerging Markets; Artisan Focus Fund—Large Growth; Artisan Global Discovery—Global Small/Mid Stock; Artisan Global Equity Fund—Global Large-Stock Growth; Artisan Global Opportunities Fund—Global Large-Stock Growth; Artisan Global Value Fund—Global Large-Stock Value; Artisan High Income Fund—High Yield Bond; Artisan International Fund—Foreign Large Growth; Artisan International Small-Mid Fund—Foreign Small/Mid Growth; Artisan International Value Fund—Foreign Large Blend; Artisan Mid Cap Fund—Mid-Cap Growth; Artisan Mid Cap Value Fund—Mid-Cap Value; Artisan Small Cap Fund—Small Growth; Artisan Sustainable Emerging Markets Fund—Diversified Emerging Markets; Artisan Value Fund—Large Value; Artisan Select Equity Fund—Large Value; Artisan International Explorer Fund—Foreign Small/Mid Blend; Artisan Floating Rate Fund—Bank Loan; Artisan Value Income Fund—Large Value; Artisan Global Unconstrained Fund—Nontraditional Bond; Artisan Emerging Markets Debt Opportunities Fund—Emerging Markets Bond. Morningstar ratings are initially given on a fund's three year track record and change monthly.
Throughout this report, we present historical information about our AUM, including information about changes in our AUM due to client cash flows, investment returns and transfers between investment vehicles (e.g., pooled investment vehicles and separate accounts). Client cash flows represent client fundings, terminations and client-initiated contributions and withdrawals (which could be in cash or in securities), but generally exclude Artisan Funds’ income and capital gain distributions that are not reinvested by fund shareholders. “Investment returns and other” represents realized gains and losses, the change in unrealized gains and losses, net income and certain miscellaneous items, immaterial in the aggregate, which may include payment of Artisan’s management fees or payment of custody expenses to the extent a client causes these fees to be paid from the account we manage. The effect of translating into U.S. dollars the value of portfolio securities denominated in currencies other than the U.S. dollar is also included in this value.
We use our information management systems to track our AUM, the components of investment returns, and client cash flows, and we believe the information set forth in this report regarding our AUM, investment returns, and client cash flows is accurate in all material respects. We also present information regarding the amount of our AUM and client cash flows sourced through particular investment vehicles, asset classes, and distribution channels. The allocation of AUM and client cash flows sourced through particular distribution channels involves estimates because precise information on the sourcing of assets invested in Artisan Funds or Artisan Global Funds through intermediaries is not available on a complete or timely basis and involves the exercise of judgment because the same assets, in some cases, might fairly be said to have been sourced from more than one distribution channel. We have presented the information on our AUM and client cash flows sourced by distribution channel in the way in which we prepare and use that information in the management of our business. Non-financial data, including information about our investment performance, client cash flows, and AUM sourced by distribution channel are not subject to our internal controls over financial reporting.
None of the information in this report constitutes either an offer or a solicitation to buy or sell any fund securities, nor is any such information a recommendation for any fund security or investment service.
iv
PART I
Item 1. Business
Overview
Founded in 1994, Artisan is a global multi-asset investment platform focused on providing high value-added active investment strategies in growing asset classes to sophisticated clients around the world. Since our founding, we have maintained a business model that is designed to maximize our ability to produce attractive investment results for our clients, and we believe this model has contributed to our success in doing so. We focus on attracting, retaining and developing talented investment professionals by creating an environment in which each investment team is provided ample resources and support, transparent and direct financial incentives, a high degree of investment autonomy, and a long-term time horizon. Each of our investment teams is led by one or more experienced portfolio managers and applies its own unique investment philosophy and process. We believe this autonomous investment team structure promotes independent analysis and accountability among our investment professionals, which we believe promotes superior investment results.
Each of our investment teams manages one or more investment strategies, each of which is designed to have a clearly articulated and consistent investment process that is well-understood by clients and managed to achieve long-term performance. Over our firm’s history, we have broadened our investment management capabilities in a disciplined manner that we believe is consistent with our overall philosophy of offering high value-added investment strategies. We have expanded our investment platform by launching new strategies managed by our existing investment teams, as well as by establishing or acquiring new investment teams when the ideal opportunity to do so arises. New investment strategies we have developed use a broad array of securities, instruments and techniques (which we call degrees of freedom) to differentiate returns and manage risk.
We launch a new strategy when we believe it has the potential to achieve superior investment performance in an area that we believe will have sustained client demand at attractive fee rates over the long term. We strive to maintain the integrity of the investment process followed in each of our strategies by rigorous adherence to the investment parameters we have communicated to our clients. We also carefully monitor our investment capacity in each investment strategy. We believe that management of our investment capacity protects our ability to deliver strong investment returns, which protects the interests of our clients and, in the long term, protects our ability to retain client assets and maintain our profit margins. In order to better achieve our long-term goals, we are willing to close a strategy to new investors or otherwise take action to slow or restrict its growth, even though our short-term results may be impacted.
In addition to our investment teams, we have a management team with a fiduciary mindset that is focused on thoughtfully growing the business over the long term while preserving a stable environment for our talented investment professionals and associates. We believe that maintaining the firm’s talent-driven business model and investment-focused culture is critical to generating sustainable, long-term outcomes for clients, which in turn is critical to generating sustainable long-term outcomes for shareholders. To that end, our management team focuses on managing the alignment of, and resources for, the firm’s investment professionals, managing our operational infrastructure to provide a distraction-free investment environment, adhering to our transparent and predictable financial model, and promoting the sustainability of the firm.
We offer our investment management capabilities primarily to institutions and through intermediaries that operate with institutional-like decision-making processes by means of separate accounts and pooled vehicles. We access traditional institutional clients primarily through relationships with investment consultants. We access other institutional-like investors primarily through consultants, alliances with major defined contribution/401(k) platforms and relationships with financial advisors and broker-dealers.
We derive essentially all of our revenues from investment management fees, which primarily are based on a specified percentage of clients’ average AUM. A small percentage of our clients and investors pay us performance fees or incentive allocations, in which a portion of the fee or allocation is based on the performance of clients’ accounts relative to a benchmark. Investment advisory fees are determined and set forth in the investment management agreements between us and our clients. Investment management agreements are generally terminable by our clients upon short or no notice. Statements regarding weighted average fee rates herein are inclusive of both management fees and performance fees (including incentive allocations), if applicable, as set forth in our investment management agreements. Artisan Funds and Artisan Global Funds do not have any performance fee or incentive allocation arrangements.
Investment Teams
We offer clients a broad range of actively managed investment strategies diversified by asset class, market cap and investment style. Each strategy is managed by one of the investment teams described below.
The following table sets forth total AUM and certain performance information for our investment teams and strategies as of December 31, 2025.
1
| Investment Team and Strategy | AUM as of December 31, 2025 | Composite Inception Date | Value-Added Since Inception Date (1) as of December 31, 2025 | Fund Rating(2) as of December 31, 2025 | |||||||||||||
| (in millions) | |||||||||||||||||
| Growth Team | |||||||||||||||||
| Global Opportunities | 16,537 | February 1, 2007 | 348 | ««« | |||||||||||||
| Global Discovery | 1,107 | September 1, 2017 | 530 | ««« | |||||||||||||
| U.S. Mid-Cap Growth | 10,280 | April 1, 1997 | 440 | ««« | |||||||||||||
| U.S. Small-Cap Growth | 2,782 | April 1, 1995 | 260 | ««« | |||||||||||||
| Franchise | 553 | October 1, 2024 | 35 | Not Applicable | |||||||||||||
| Global Equity Team | |||||||||||||||||
| Global Equity | 432 | April 1, 2010 | 373 | «««« | |||||||||||||
| Non-U.S. Growth | 15,475 | January 1, 1996 | 456 | ««««« | |||||||||||||
| U.S. Value Team | |||||||||||||||||
| Value Equity | 5,750 | July 1, 2005 | 149 | «««« | |||||||||||||
| U.S. Mid-Cap Value | 2,113 | April 1, 1999 | 191 | « | |||||||||||||
| Value Income | 17 | March 1, 2022 | (744) | «« | |||||||||||||
| International Value Group | |||||||||||||||||
| International Value | 53,064 | July 1, 2002 | 515 | ««««« | |||||||||||||
| International Explorer | 912 | November 1, 2020 | 401 | ««« | |||||||||||||
| Global Special Situations | 34 | April 1, 2025 | (140) | Not Applicable | |||||||||||||
| Global Value Team | |||||||||||||||||
| Global Value | 36,280 | July 1, 2007 | 301 | «««« | |||||||||||||
| Select Equity | 984 | March 1, 2020 | (147) | «««« | |||||||||||||
| Sustainable Emerging Markets Team | |||||||||||||||||
| Sustainable Emerging Markets | 2,537 | July 1, 2006 | 118 | «««« | |||||||||||||
| Credit Team | |||||||||||||||||
| High Income | 13,191 | April 1, 2014 | 232 | ««««« | |||||||||||||
| Credit Opportunities | 367 | July 1, 2017 | 1,091 | Not Applicable | |||||||||||||
| Floating Rate | 93 | January 1, 2022 | 84 | «««« | |||||||||||||
Custom Credit Solutions (3) | 1,400 | July 1, 2025 | --- | Not Applicable | |||||||||||||
| Developing World Team | |||||||||||||||||
| Developing World | 4,283 | July 1, 2015 | 531 | «««« | |||||||||||||
| Antero Peak Group | |||||||||||||||||
| Antero Peak | 2,220 | May 1, 2017 | 415 | ««« | |||||||||||||
| Antero Peak Hedge | 226 | November 1, 2017 | (73) | Not Applicable | |||||||||||||
| International Small-Mid Team | |||||||||||||||||
| Non-U.S. Small-Mid Growth | 4,913 | January 1, 2019 | 123 | ««« | |||||||||||||
| EMsights Capital Group | |||||||||||||||||
| Global Unconstrained | 1,185 | April 1, 2022 | 708 | ««««« | |||||||||||||
| Emerging Markets Debt Opportunities | 1,332 | May 1, 2022 | 630 | ««««« | |||||||||||||
| Emerging Markets Local Opportunities | 1,861 | August 1, 2022 | 395 | Not Applicable | |||||||||||||
Total AUM as of December 31, 2025 | 179,928 | ||||||||||||||||
2
(1) Value-added is the amount, in basis points, by which the average annual gross composite return of each of our strategies has outperformed or underperformed its respective benchmark. See “Investment Performance, Client Cash Flows and AUM Information Used in this Report” for information regarding the benchmarks used. Value-added for periods less than one year is not annualized. | |||||||||||||||||
(2) The Overall Morningstar RatingTM applicable to the Artisan Fund managed to each investment strategy is derived from a weighted average of the performance figures associated with its three-year, five-year, and ten-year (if applicable) Morningstar Ratings metrics. Not all investment strategies have a corresponding series of Artisan Funds. | |||||||||||||||||
(3) Custom Credit Solutions represents assets managed by the Credit team within custom, investor-driven mandates for which there is no combined performance track record. | |||||||||||||||||
Growth Team
Our Growth team manages five investment strategies. James D. Hamel, Matthew H. Kamm, Jason L. White, Jay C. Warner and Angela Wu are portfolio managers of the Global Opportunities, Global Discovery, U.S. Mid-Cap Growth and U.S. Small-Cap Growth strategies. Mr. Hamel and Ms. Wu are the co-lead portfolio managers of the Global Opportunities and Franchise strategies; Mr. White is the lead portfolio manager of the Global Discovery strategy; Mr. Kamm and Mr. White are the co-lead portfolio managers of the U.S. Mid-Cap Growth strategy; and Mr. Warner is the lead portfolio manager of the U.S. Small-Cap Growth strategy.
| As of December 31, 2025 | |||||||||||||||||||||||||||||
| Investment Strategy (Composite Inception Date) | 1 Year | 3 Years | 5 Years | 10 Years | Inception | ||||||||||||||||||||||||
| Global Opportunities (February 1, 2007) | |||||||||||||||||||||||||||||
| Average Annual Gross Returns | 10.14 | % | 16.73 | % | 5.25 | % | 12.42 | % | 11.00 | % | |||||||||||||||||||
| MSCI All Country World Index | 22.34 | % | 20.63 | % | 11.19 | % | 11.71 | % | 7.52 | % | |||||||||||||||||||
| Global Discovery (September 1, 2017) | |||||||||||||||||||||||||||||
| Average Annual Gross Returns | 13.25 | % | 17.59 | % | 5.33 | % | — | % | 13.51 | % | |||||||||||||||||||
| MSCI All Country World Small Mid Cap Index | 19.29 | % | 14.56 | % | 7.27 | % | — | % | 8.21 | % | |||||||||||||||||||
| U.S. Mid-Cap Growth (April 1, 1997) | |||||||||||||||||||||||||||||
| Average Annual Gross Returns | 16.05 | % | 18.13 | % | 3.33 | % | 12.08 | % | 14.33 | % | |||||||||||||||||||
Russell® Midcap Index | 10.60 | % | 14.34 | % | 8.67 | % | 11.00 | % | 10.32 | % | |||||||||||||||||||
Russell® Midcap Growth Index | 8.66 | % | 18.62 | % | 6.64 | % | 12.48 | % | 9.93 | % | |||||||||||||||||||
| U.S. Small-Cap Growth (April 1, 1995) | |||||||||||||||||||||||||||||
Average Annual Gross Returns | 9.56 | % | 12.26 | % | (1.42) | % | 11.82 | % | 10.55 | % | |||||||||||||||||||
Russell® 2000 Index | 12.81 | % | 13.72 | % | 6.09 | % | 9.61 | % | 9.05 | % | |||||||||||||||||||
Russell® 2000 Growth Index | 13.01 | % | 15.57 | % | 3.18 | % | 9.57 | % | 7.95 | % | |||||||||||||||||||
| Franchise (October 1, 2024) | |||||||||||||||||||||||||||||
| Average Annual Gross Returns | 21.10 | % | — | % | — | % | — | % | 16.89 | % | |||||||||||||||||||
| MSCI All Country World Index | 22.34 | % | — | % | — | % | — | % | 16.54 | % | |||||||||||||||||||
3
Global Equity Team
Our Global Equity team manages the Global Equity strategy and the Non-U.S. Growth strategy. Mark L. Yockey serves as portfolio manager of both strategies and Charles-Henri Hamker serves as portfolio manager of the Global Equity strategy and associate portfolio manager of the Non-U.S. Growth strategy. During 2025, the Company wound down the team’s China Post-Venture strategy.
| As of December 31, 2025 | |||||||||||||||||||||||||||||
| Investment Strategy (Composite Inception Date) | 1 Year | 3 Years | 5 Years | 10 Years | Inception | ||||||||||||||||||||||||
| Global Equity (April 1, 2010) | |||||||||||||||||||||||||||||
| Average Annual Gross Returns | 47.84 | % | 25.85 | % | 11.25 | % | 14.37 | % | 13.66 | % | |||||||||||||||||||
| MSCI All Country World Index | 22.34 | % | 20.63 | % | 11.19 | % | 11.71 | % | 9.93 | % | |||||||||||||||||||
| Non-U.S. Growth (January 1, 1996) | |||||||||||||||||||||||||||||
| Average Annual Gross Returns | 37.93 | % | 21.19 | % | 9.83 | % | 9.47 | % | 10.22 | % | |||||||||||||||||||
| MSCI EAFE Index | 31.22 | % | 17.21 | % | 8.92 | % | 8.18 | % | 5.66 | % | |||||||||||||||||||
U.S. Value Team
Our U.S. Value team manages the Value Equity, U.S. Mid-Cap Value and Value Income strategies. Thomas A. Reynolds, Daniel L. Kane and Craig Inman serve as the portfolio managers for each strategy. Mr. Kane has announced his intention to step back from portfolio management responsibilities effective June 30, 2026; he will remain on the U.S. Value team as a managing director and adviser.
| As of December 31, 2025 | |||||||||||||||||||||||||||||
| Investment Strategy (Composite Inception Date) | 1 Year | 3 Years | 5 Years | 10 Years | Inception | ||||||||||||||||||||||||
| Value Equity (July 1, 2005) | |||||||||||||||||||||||||||||
| Average Annual Gross Returns | 14.66 | % | 17.76 | % | 13.28 | % | 13.57 | % | 9.86 | % | |||||||||||||||||||
Russell® 1000 Index | 17.37 | % | 22.72 | % | 13.58 | % | 14.58 | % | 10.97 | % | |||||||||||||||||||
Russell® 1000 Value Index | 15.91 | % | 13.88 | % | 11.32 | % | 10.52 | % | 8.37 | % | |||||||||||||||||||
| U.S. Mid-Cap Value (April 1, 1999) | |||||||||||||||||||||||||||||
Average Annual Gross Returns | 2.82 | % | 9.07 | % | 7.82 | % | 9.11 | % | 11.48 | % | |||||||||||||||||||
Russell® Midcap Index | 10.60 | % | 14.34 | % | 8.67 | % | 11.00 | % | 9.67 | % | |||||||||||||||||||
Russell® Midcap Value Index | 11.05 | % | 12.26 | % | 9.82 | % | 9.77 | % | 9.57 | % | |||||||||||||||||||
| Value Income (March 1, 2022) | |||||||||||||||||||||||||||||
| Average Annual Gross Returns | 11.35 | % | 11.48 | % | — | % | — | % | 6.61 | % | |||||||||||||||||||
| S&P 500 Index | 17.88 | % | 22.98 | % | — | % | — | % | 14.05 | % | |||||||||||||||||||
4
International Value Group
The International Value Group, led by N. David Samra, manages three investment strategies: International Value, International Explorer and Global Special Situations. Mr. Samra and Ian P. McGonigle serve as portfolio managers and Benjamin L. Herrick serves as associate portfolio manager of the International Value strategy. Mr. Samra also serves as managing director of the International Explorer and Global Special Situations strategies. Beini Zhou and Anand Vasagiri serve as co-portfolio managers of the International Explorer strategy. Brian Louko serves as the portfolio manager of the Global Special Situations strategy.
| As of December 31, 2025 | |||||||||||||||||||||||||||||
| Investment Strategy (Composite Inception Date) | 1 Year | 3 Years | 5 Years | 10 Years | Inception | ||||||||||||||||||||||||
| International Value (July 1, 2002) | |||||||||||||||||||||||||||||
| Average Annual Gross Returns | 24.05 | % | 18.39 | % | 12.97 | % | 11.18 | % | 12.03 | % | |||||||||||||||||||
| MSCI EAFE Index | 31.22 | % | 17.21 | % | 8.92 | % | 8.18 | % | 6.88 | % | |||||||||||||||||||
| International Explorer (October 1, 2020) | |||||||||||||||||||||||||||||
| Average Annual Gross Returns | 20.17 | % | 16.43 | % | 10.57 | % | — | % | 14.83 | % | |||||||||||||||||||
| MSCI All Country World Index Ex USA Small Cap | 29.26 | % | 15.59 | % | 6.90 | % | — | % | 10.82 | % | |||||||||||||||||||
| Global Special Situations Strategy (April 1, 2025) | |||||||||||||||||||||||||||||
| Average Annual Gross Returns | — | % | — | % | — | % | — | % | 7.22 | % | |||||||||||||||||||
| ICE BofA Global High Yield Index | — | % | — | % | — | % | — | % | 8.62 | % | |||||||||||||||||||
Global Value Team
Our Global Value team, led by Daniel J. O’Keefe, manages the Global Value and Select Equity strategies. Mr. O’Keefe serves as lead portfolio manager and Michael J. McKinnon serves as portfolio manager of both strategies.
| As of December 31, 2025 | |||||||||||||||||||||||||||||
| Investment Strategy (Composite Inception Date) | 1 Year | 3 Years | 5 Years | 10 Years | Inception | ||||||||||||||||||||||||
| Global Value (July 1, 2007) | |||||||||||||||||||||||||||||
| Average Annual Gross Returns | 35.45 | % | 24.71 | % | 14.65 | % | 12.46 | % | 10.22 | % | |||||||||||||||||||
MSCI All Country World Index | 22.34 | % | 20.63 | % | 11.19 | % | 11.71 | % | 7.21 | % | |||||||||||||||||||
| Select Equity (March 1, 2020) | |||||||||||||||||||||||||||||
| Average Annual Gross Returns | 30.58 | % | 24.95 | % | 13.91 | % | — | % | 15.77 | % | |||||||||||||||||||
S&P 500 Index | 17.88 | % | 22.98 | % | 14.42 | % | — | % | 17.24 | % | |||||||||||||||||||
Sustainable Emerging Markets Team
Our Sustainable Emerging Markets (SEM) team manages one investment strategy. Maria Negrete-Gruson is the portfolio manager of the Sustainable Emerging Markets strategy.
| As of December 31, 2025 | |||||||||||||||||||||||||||||
| Investment Strategy (Composite Inception Date) | 1 Year | 3 Years | 5 Years | 10 Years | Inception | ||||||||||||||||||||||||
| Sustainable Emerging Markets (July 1, 2006) | |||||||||||||||||||||||||||||
| Average Annual Gross Returns | 43.91 | % | 22.58 | % | 5.99 | % | 11.02 | % | 6.95 | % | |||||||||||||||||||
| MSCI Emerging Markets Index | 33.57 | % | 16.38 | % | 4.19 | % | 8.41 | % | 5.77 | % | |||||||||||||||||||
5
Credit Team
Our Credit team manages the High Income, Credit Opportunities and Floating Rate strategies. Bryan C. Krug serves as portfolio manager of all three strategies. Seth B. Yeager also serves as portfolio manager of the Floating Rate strategy.
| As of December 31, 2025 | |||||||||||||||||||||||||||||
| Investment Strategy (Composite Inception Date) | 1 Year | 3 Years | 5 Years | 10 Years | Inception | ||||||||||||||||||||||||
| High Income (April 1, 2014) | |||||||||||||||||||||||||||||
| Average Annual Gross Returns | 9.08 | % | 11.74 | % | 6.32 | % | 8.16 | % | 7.31 | % | |||||||||||||||||||
| ICE BofA US High Yield Index | 8.50 | % | 10.02 | % | 4.49 | % | 6.44 | % | 4.99 | % | |||||||||||||||||||
| Credit Opportunities (July 1, 2017) | |||||||||||||||||||||||||||||
| Average Annual Gross Returns | 11.06 | % | 18.58 | % | 13.73 | % | — | % | 13.57 | % | |||||||||||||||||||
| ICE BofA US Dollar 3-Month Deposit Offered Rate Constant Maturity Index | 4.42 | % | 5.00 | % | 3.25 | % | — | % | 2.66 | % | |||||||||||||||||||
| Floating Rate (January 1, 2022) | |||||||||||||||||||||||||||||
| Average Annual Gross Returns | 7.50 | % | 10.35 | % | — | % | — | % | 7.45 | % | |||||||||||||||||||
| S&P UBS Leveraged Loan Index | 5.94 | % | 9.30 | % | — | % | — | % | 6.61 | % | |||||||||||||||||||
Developing World Team
Our Developing World team, led by Lewis S. Kaufman as portfolio manager, manages the Developing World strategy.
| As of December 31, 2025 | |||||||||||||||||||||||||||||
| Investment Strategy (Composite Inception Date) | 1 Year | 3 Years | 5 Years | 10 Years | Inception | ||||||||||||||||||||||||
| Developing World (July 1, 2015) | |||||||||||||||||||||||||||||
| Average Annual Gross Returns | 9.15 | % | 22.93 | % | 0.17 | % | 13.37 | % | 11.36 | % | |||||||||||||||||||
| MSCI Emerging Markets Index | 33.57 | % | 16.38 | % | 4.19 | % | 8.41 | % | 6.05 | % | |||||||||||||||||||
Antero Peak Group
The Antero Peak Group manages the Antero Peak and Antero Peak Hedge strategies. Christopher P. Smith is the portfolio manager of both strategies.
| As of December 31, 2025 | |||||||||||||||||||||||||||||
| Investment Strategy (Composite Inception Date) | 1 Year | 3 Years | 5 Years | 10 Years | Inception | ||||||||||||||||||||||||
| Antero Peak (May 1, 2017) | |||||||||||||||||||||||||||||
| Average Annual Gross Returns | 21.80 | % | 23.66 | % | 12.20 | % | — | % | 18.98 | % | |||||||||||||||||||
| S&P 500 Index | 17.88 | % | 22.98 | % | 14.42 | % | — | % | 14.83 | % | |||||||||||||||||||
| Antero Peak Hedge (November 1, 2017) | |||||||||||||||||||||||||||||
| Average Annual Gross Returns | 18.28 | % | 20.32 | % | 9.92 | % | — | % | 13.86 | % | |||||||||||||||||||
| S&P 500 Index | 17.88 | % | 22.98 | % | 14.42 | % | — | % | 14.59 | % | |||||||||||||||||||
6
International Small-Mid Team
Our International Small-Mid team, led by Rezo Kanovich as portfolio manager, manages the Non-U.S. Small-Mid Growth strategy.
| As of December 31, 2025 | |||||||||||||||||||||||||||||
| Investment Strategy (Composite Inception Date) | 1 Year | 3 Years | 5 Years | 10 Years | Inception | ||||||||||||||||||||||||
| Non-U.S. Small-Mid Growth (January 1, 2019) | |||||||||||||||||||||||||||||
| Average Annual Gross Returns | 19.78 | % | 10.73 | % | 1.92 | % | — | % | 10.86 | % | |||||||||||||||||||
| MSCI All Country World Index Ex USA Small Mid Cap | 30.74 | % | 16.13 | % | 6.80 | % | — | % | 9.63 | % | |||||||||||||||||||
EMsights Capital Group
The EMsights Capital Group manages the Global Unconstrained, Emerging Markets Debt Opportunities and Emerging Markets Local Opportunities strategies. Michael A. Cirami and Sarah C. Orvin serve as the portfolio managers of each strategy.
| As of December 31, 2025 | |||||||||||||||||||||||||||||
| Investment Strategy (Composite Inception Date) | 1 Year | 3 Years | 5 Years | 10 Years | Inception | ||||||||||||||||||||||||
| Global Unconstrained (April 1, 2022) | |||||||||||||||||||||||||||||
| Average Annual Gross Returns | 12.79 | % | 11.30 | % | — | % | — | % | 11.30 | % | |||||||||||||||||||
| ICE BofA 3-month Treasury Bill Index | 4.18 | % | 4.81 | % | — | % | — | % | 4.22 | % | |||||||||||||||||||
| Emerging Markets Debt Opportunities (May 1, 2022) | |||||||||||||||||||||||||||||
| Average Annual Gross Returns | 16.77 | % | 14.01 | % | — | % | — | % | 13.74 | % | |||||||||||||||||||
| J.P. Morgan EMB Hard Currency/Local Currency 50-50 | 15.34 | % | 9.54 | % | — | % | — | % | 7.44 | % | |||||||||||||||||||
| Emerging Markets Local Opportunities (August 1, 2022) | |||||||||||||||||||||||||||||
| Average Annual Gross Returns | 25.39 | % | 13.73 | % | — | % | — | % | 13.16 | % | |||||||||||||||||||
| J.P. Morgan GBI-EM Global Diversified Index | 19.26 | % | 9.47 | % | — | % | — | % | 9.21 | % | |||||||||||||||||||
Grandview Property Partners
On January 2, 2026, we closed on the acquisition of Grandview Property Partners, a real estate private equity firm specializing in originating, developing, acquiring and managing middle market properties across the United States. Grandview has raised three closed-end draw-down funds since its founding and, as of January 31, 2026, managed approximately $895 million in institutional assets across its flagship fund series and co-investment program. The leadership team of Grandview consists of Rajesh G. Menon, Dean Sotter, Eric Freeman and Jeffrey Usas.
Distribution, Investment Products and Client Relationships
The goal of our marketing, distribution and client service efforts is to grow and maintain a client base that is diversified by investment strategy, client type, distribution channel and geographic region. We focus our distribution and marketing efforts on sophisticated investors and asset allocators, including institutions and intermediaries that operate with institutional-like, centralized decision-making processes and longer-term investment horizons. We have designed our distribution strategies and structured our distribution teams to use knowledgeable, seasoned sales and client service professionals in a way intended to limit the time our investment professionals spend on marketing and client service activities. We believe that minimizing other demands allows our portfolio managers and other investment professionals to focus their energies and attention on the investment decision-making process, which we believe enhances the opportunity to achieve superior investment returns.
Institutional Channel
Our institutional distribution channel includes institutional clients, such as U.S.-registered mutual funds, non-U.S. funds and collective investment trusts we advise; state and local governments; employee benefit plans including Taft-Hartley plans; foundations; and endowments. Our institutional channel also includes AUM sourced from defined contribution plans. We offer our investment products to institutional clients directly and by marketing our services to the investment consultants and advisors that advise them. As of December 31, 2025, approximately 25% of our AUM were attributed to clients represented by investment consultants. As of December 31, 2025, 39% of our AUM were sourced through our institutional channel.
7
Intermediated Wealth Channel
We maintain relationships with a number of major brokerage firms and larger private banks and trust companies at which the process for identifying which investment products to offer has been centralized to a relatively limited number of key decision-makers that exhibit institutional-like decision-making behavior. We also maintain relationships with a number of financial advisory firms and broker-dealer advisors that offer our investment products to their clients. AUM sourced via these third-party financial intermediaries constitute the majority of our intermediated wealth channel. Our intermediated wealth channel also includes AUM from investors who invest in Artisan Funds directly or through mutual fund supermarkets. As of December 31, 2025, approximately 61% of our AUM were sourced through our intermediated wealth channel.
Access Through a Range of Investment Vehicles
Our clients access our investment strategies through a range of investment vehicles, including separate accounts and pooled vehicles. As of December 31, 2025, Artisan Funds and Artisan Global Funds accounted for approximately 49% of our total AUM, and approximately 51% of our AUM were managed in separate accounts and other pooled vehicles.
Separate Accounts and Other Pooled Investment Vehicles (“Separate Accounts and Other”)
We manage traditional separate accounts within most of our investment strategies. As of December 31, 2025, we managed 208 traditional separate accounts spanning 126 client relationships, with our largest separate account relationship representing approximately 12% of our AUM. These separate account clients include both institutional and intermediated wealth channel relationships, such as pension and profit sharing plans, corporations, trusts, endowments, foundations, charitable organizations, high net worth individuals, governmental entities, insurance companies, commingled investment vehicles, investment advisers and other financial institutions, trustees of collective investment trusts and investment companies and similar pooled investment vehicles. The fees we charge on separate accounts vary by client, investment strategy and the size of the account. Fees are accrued on a monthly basis and are generally paid quarterly in arrears.
A number of our investment strategies are accessible to certain types of employee benefit plans through Artisan-branded collective investment trusts, or CITs. We act as investment adviser to the CITs and earn a management fee for providing this service. As of December 31, 2025, CITs represented approximately 5% of our AUM.
Certain of our investment strategies are offered through Artisan-sponsored, unregistered pooled investment vehicles, referred to as Artisan Private Funds. For serving as investment adviser to Artisan Private Funds, we earn a management fee and, for certain funds, are entitled to receive either an allocation of profits or a performance-based fee. As of December 31, 2025, Artisan Private Funds comprised approximately 2% of our AUM.
In our reporting materials, unless otherwise stated, our “separate accounts and other” AUM includes assets we manage in traditional separate accounts, Artisan-branded CITs and Artisan Private Funds, as well as certain Custom Credit Solutions, which represent assets managed by the Credit team within custom, investor-driven mandates. In addition, assets under advisement related to clients for whom we provide investment models but do not have discretionary investment authority are included within the “separate accounts and other” category. As of December 31, 2025, assets under advisement represented less than 1% of our AUM.
Artisan Funds and Artisan Global Funds
U.S. investors that do not meet our minimum account size for a separate account, or who otherwise prefer to invest through a mutual fund, can invest in most of our strategies through Artisan Funds. We serve as the investment adviser to each series of Artisan Funds, which are SEC-registered mutual funds that offer no-load, no 12b-1 share classes designed to meet the needs of a range of investors. Each series of Artisan Funds corresponds to an investment strategy we offer to clients. We earn management fees, which are based on the average daily net assets of each Artisan Fund and are paid monthly, for serving as investment adviser to these funds. As of December 31, 2025, Artisan Funds represented approximately 44% of our AUM.
We also serve as investment manager of Artisan Global Funds, a family of Ireland-based UCITS funds. Artisan Global Funds provides non-U.S. investors with access to a number of our investment strategies in a pooled vehicle structure. We earn investment management fees, which are based on the average daily net assets of each sub-fund and are generally paid monthly, for serving as investment adviser to these funds. As of December 31, 2025, Artisan Global Funds represented approximately 5% of our AUM.
Regulatory Environment and Compliance
Our business is subject to extensive regulation in the United States at the federal level and, to a lesser extent, the state level, as well as by self-regulatory organizations and regulators located outside the United States. Under these laws and regulations, agencies that regulate investment advisers, investment funds and other related entities have broad authority, including the power to limit, restrict or prohibit the regulated entity from conducting business in the event that it fails to comply with such laws and regulations. Breaches of these laws and regulations could result in regulatory enforcement actions, civil liability, criminal liability and/or the imposition of sanctions, including monetary damages, injunctions, disgorgements, fines, censures, and the revocation, cancellation, suspension or restriction of licenses, registration status or approvals held by us or our employees in a jurisdiction or market. In addition, a regulatory proceeding, regardless of whether it results in a sanction, can require substantial expenditures and can have an adverse effect on our reputation or business.
8
The domestic, international and extra-territorial laws and regulations that apply to our business relate to a broad range of subjects, including securities, compliance, corporate governance, financial reporting and disclosure, tax, privacy and data protection, sustainability, information security, anti-bribery and anti-corruption, anti-money laundering and anti-terrorist financing. These laws and regulations are complex and continue to change and evolve over time. As a result, there is a level of uncertainty associated with the regulatory environments in which we operate. Accordingly, the discussion below is general in nature, does not purport to be complete and is current only as of the date of this report.
U.S. Regulation
As a publicly traded company, we are subject to U.S. federal securities laws, state securities and corporate laws, and the rules and regulations of U.S. regulatory and self-regulatory organizations. In particular, we are subject to the Securities Act of 1933, the Securities Exchange Act of 1934 (the “Exchange Act”), the Dodd-Frank Wall Street Reform and Consumer Protection Act of 2010, the Sarbanes-Oxley Act of 2002 and, because we are listed on the New York Stock Exchange, the NYSE listing rules.
Artisan Partners Limited Partnership, Artisan Partners UK LLP and Grandview Property Partners are registered with the SEC as investment advisers under the Investment Advisers Act of 1940 (the “Advisers Act”). Artisan Funds and several of the investment companies Artisan Partners Limited Partnership sub-advises are registered under the Investment Company Act of 1940 (the “1940 Act”). The Advisers Act and the 1940 Act, together with other applicable securities laws and the SEC’s regulations and interpretations thereunder, impose substantive and material restrictions and requirements on the operations of investment advisers and mutual funds. The SEC is authorized to institute proceedings and impose sanctions for violations, ranging from fines and censures to, in the case of investment advisers, the termination of an adviser’s registration.
Artisan Partners Limited Partnership is registered with the Commodity Futures Trading Commission (“CFTC”) as a commodity pool operator, and is a member of the National Futures Association (“NFA”), with respect to its management of certain investment vehicles. The CFTC and NFA each administer a comparable regulatory system covering futures, swaps and other derivative instruments. As the commodity pool operator of these investment vehicles, Artisan Partners claims relief under the Commodity Exchange Act from certain reporting and recordkeeping requirements. Artisan Partners is exempt from the obligations of a registered commodity pool operator with respect to certain funds and vehicles.
Artisan Partners Limited Partnership is a fiduciary under the Employee Retirement Income Security Act of 1974, as amended, (“ERISA”) with respect to assets that we manage for certain benefit plan clients. ERISA imposes duties on persons who are ERISA fiduciaries, and prohibits certain transactions between related parties to a retirement plan. The U.S. Department of Labor administers ERISA and regulates plan fiduciaries, including investment advisers who service retirement plan clients.
Artisan Partners Distributors LLC, our SEC-registered limited purpose broker-dealer subsidiary, is subject to the Exchange Act, the SEC’s rules promulgated thereunder and the rules and regulations of the Financial Industry Regulatory Authority (“FINRA”), which generally relate to sales practices, registration of personnel, compliance and supervision, and compensation and disclosure. FINRA has the authority to conduct periodic examinations of member broker-dealers, and may initiate administrative proceedings. Artisan Partners Distributors LLC is also subject to the SEC’s Uniform Net Capital Rule and the National Securities Clearing Corporation’s excess net capital requirement, which require that at least a minimum amount of a registered broker-dealer’s assets be kept in relatively liquid form.
The legislative and regulatory environment in the U.S. is subject to continual change. In addition, the firm’s increasing product and vehicle complexity introduces a broader and evolving set of regulatory requirements. New or changing legal or regulatory requirements can add further complexity to our business and operations, and addressing such requirements may require substantial expenditures of time and capital.
Non-U.S. Regulation
In addition to the extensive regulation we are subject to in the United States, a number of our subsidiaries and certain of our non-U.S. operations are subject to regulation in non-U.S. jurisdictions. Some laws in non-U.S. jurisdictions are also extra-territorial and may apply to our business.
Artisan Partners UK LLP is authorized and regulated by the U.K. Financial Conduct Authority, which is responsible for the conduct of business and supervision of financial firms in the United Kingdom. Artisan Partners UK LLP and employees who conduct FCA-regulated activities, such as the distribution of Artisan Global Funds and the provision of advisory services within the U.K., are subject to applicable FCA rules. The FCA imposes a comprehensive system of regulation that is primarily principles-based (compared to the primarily rules-based U.S. regulatory system) and govern, among other things, capital resources requirements, senior management arrangements, business conduct, interaction with clients, and systems and controls.
APEL Financial Distribution Services Limited is authorized and regulated by the Central Bank of Ireland, which regulates our Irish business activities, including our management and distribution of Artisan Global Funds, a family of Ireland-domiciled UCITS funds. Artisan Global Funds are registered for sale in many countries around the world, both in the EU and beyond, and thus are also subject to the laws of, and supervision by, the governmental authorities of those countries.
Artisan Partners Hong Kong Limited, our Hong Kong subsidiary, is licensed and regulated by the Hong Kong Securities and Futures Commission (the “SFC”). Artisan Partners Hong Kong Limited and its employees conducting regulated activities under the Securities and Futures Ordinance are subject to the rules, codes and guidelines issued by the SFC from time to time.
9
We have historically operated in Australia on the basis of a “sufficient equivalence relief” exemption from local licensing with the Australian Securities and Investments Commission. The current “sufficient equivalence relief” regime is the subject of new proposed legislation, which, if passed, will replace the current licensing regime for foreign financial service providers like us. Currently, foreign financial service providers can continue to rely on the “sufficient equivalence relief” until March 2027, and Artisan Partners Limited Partnership or its affiliates may need to apply for and obtain an Australian financial services license or rely on a new exemption by then.
Certain Artisan Private Funds are regulated as mutual funds under the Mutual Funds Law (as amended) of the Cayman Islands. The Cayman Islands Monetary Authority has supervisory and enforcement powers to ensure the funds’ compliance with the Mutual Funds Law.
Our business is also subject to the rules and regulations of the countries in which we conduct distribution or investment management activities. We have relationships with clients located outside of the U.S., which are subject to the laws and regulations of the jurisdictions in which the client is domiciled. In addition, 50% of our AUM were invested in securities denominated in currencies other than the U.S. dollar as of December 31, 2025. Our investments in these non-U.S. securities subject us to certain laws and regulations of the jurisdictions in which the issuer resides or is traded. We may also be subject to U.S. laws and regulations with respect to our distribution or investment management activities in non-U.S. markets, including in jurisdictions that may be considered higher risk.
We may become subject to additional regulatory demands in the future to the extent there are regulatory changes in jurisdictions in which we currently operate or invest, or we expand our business in existing and new jurisdictions. See “Risk Factors—Risks Related to Legal or Regulatory Factors and Taxation.”
Industry Trends and Competition
The investment management industry continues to evolve as market trends and other forces create headwinds for traditional asset management firms.
•Passive and alternative investment options continue to gain market share, while traditional actively managed equity strategies, in particular, continue to remain in net outflows.
•Shifts in the global distribution landscape continue to put pressure on traditional distribution practices.
In response to these and other headwinds, we have continued to build out our alternatives capabilities and increase degrees of investment freedom within our existing investment strategies. We also regularly evaluate potential new investment teams and talent, as well as new investment structures and vehicles in an effort to enhance and expand our investment platform. In addition, we continue to evolve our distribution structure, incorporating specialized resources, expanding strategic partnerships and evolving our product architecture to align with client demand.
The industry in which we operate is highly competitive. In order to be successful and grow our business, we must be able to compete effectively for AUM. We compete to attract clients and investors principally on the basis of:
•the performance of our investment strategies
•the continuity of our investment and distribution professionals
•the range of investment strategies and vehicles we offer
•the quality of the service we provide to our clients
•our brand recognition and reputation within the investing community
•the fees we charge for the investment management services we provide
We compete in all aspects of our business with a large number of investment management firms, commercial banks, broker-dealers, insurance companies and other financial institutions. For additional information concerning the competitive risks that we face, see “Risk Factors—Competition and Distribution Risks—The investment management industry is intensely competitive and experiencing transformative pressures.”
10
Human Capital Resources
As a talent-driven business, we believe our people are the firm’s greatest asset. We commit tremendous energy to talent management. As of December 31, 2025, we employed 567 associates. Approximately 29% of our associates work within our investment teams, 19% within our distribution teams and 52% within our business management and operations teams. Approximately 94% of our associates operate from our U.S. offices and 6% operate from our offices outside of the U.S.
We seek to recruit, retain and promote outstanding people at all levels and in all functions, who thrive in broad roles and want to maximize their potential. The firm seeks people with creative perspectives and an entrepreneurial spirit who are self-motivated to build their careers in alignment with our purpose of generating and compounding wealth for clients. Recognizing that talent exists everywhere, we are committed to identifying and advancing the best talent that will thrive in our business.
We focus on providing a professional environment where our associates can be successful over a long-term time horizon, ideally throughout their careers. Our commitment to human capital development takes many forms, including supporting ongoing education and professional development, offering a flat management structure with easy access to senior managers and working closely with associates on career goals and interests to create development pathways and opportunities for advancement when possible.
Through Artisan Unity, we support associate-led groups that strengthen community and help our associates to do their best work. These groups reinforce our commitment to an environment where our talented associates are supported and able to thrive. As collaborative networks, they encourage engagement, promote professional and personal growth and promote unity across our community.
As an ideal home for talent, we provide attractive compensation and benefits programs. We regularly review compensation paid to associates to ensure it is competitive, equitable and fair for the role, experience, location and individual contribution. We provide equity or equity-linked incentives to all of our associates in order to align their economic interests with those of our clients and stockholders. We encourage our associates to save for retirement. In the U.S., we match 100% of associate 401(k) contributions dollar for dollar (fully vested), up to the IRS limit. We also maintain competitive retirement programs or benefits for all non-U.S. associates. In addition, we offer a comprehensive benefits program that is available to all associates regardless of title, role or responsibility.
Sustainability
Artisan Partners’ purpose is to generate and compound wealth over the long-term for our clients. The wealth we generate improves retirement outcomes, pays for education, funds charitable purposes and in general improves people’s lives. In addition to generating successful investment outcomes for our clients, we strive to promote success across a diverse group of associates and generate sustainable financial outcomes for our shareholders.
To achieve our purpose, we must continue to thoughtfully grow our business over the long term while preserving a consistent environment in which our talented investment professionals and associates can thrive. Maintaining our talent-driven business model and investment-focused culture is critical to providing a stable environment for our associates, generating sustainable, long-term investment outcomes for clients and creating long-term successful financial outcomes for shareholders.
To us, sustainability means the following:
•Building relationships with the right clients, on the right terms and with the right long-term investment horizons. We foster client relationships by prioritizing investment returns. Prioritizing clients’ investment returns may, at times, require us to limit client cash flows and overall assets managed in a strategy—a practice we refer to as capacity management.
•Using a deliberate process to bring on new investment talent, launch new strategies and vehicles and build sustainable franchises. We are patient in developing our talent, teams and strategies. We are comfortable with evolving—and sometimes even disrupting—our firm to increase the probability of long-term successful investment outcomes through market cycles.
•Compelling work in a tailored environment, with long-term opportunities for associates across our firm. Our culture promotes associates’ success—ideally over their entire careers—with economic alignment in the form of variable compensation and long-duration incentive awards.
•Growing our business value while maintaining financial discipline and continuing to generate and distribute significant cash to our shareholders. By taking care of our people and fulfilling our fiduciary duty to our clients, we create a waterfall effect that helps generate sustainable financial outcomes for our shareholders over the long term.
11
Our Structure
Holding Company Structure
We are a holding company and our assets principally consist of our ownership of partnership units of Artisan Partners Holdings, deferred tax assets and cash. As the sole general partner of Artisan Partners Holdings, we operate and control all of its business and affairs, subject to certain voting rights of its limited partners. We conduct all of our business activities through operating subsidiaries of Artisan Partners Holdings. Net profits and net losses are allocated based on the ownership of partnership units of Artisan Partners Holdings. As of December 31, 2025, we owned approximately 87% of Artisan Partners Holdings, and the other 13% was owned by the limited partners of Artisan Partners Holdings.
Our holding company structure is predominantly a result of our IPO, which we completed in March 2013. In connection with the IPO, we and Artisan Partners Holdings completed a series of reorganization transactions, which we refer to as the IPO Reorganization, in order to reorganize our capital structures in preparation for the IPO. The IPO Reorganization included, among other changes, the following:
•Our appointment as the sole general partner of Artisan Partners Holdings.
•The modification of our capital structure into three classes of common stock and a series of convertible preferred stock. We issued shares of our Class B common stock and Class C common stock and convertible preferred stock to pre-IPO partners of Artisan Partners Holdings. Each share of Class B common stock corresponds to a Class B common unit of Artisan Partners Holdings. Each share of Class C common stock corresponds to either a Class A, Class D or Class E common unit of Artisan Partners Holdings. Subject to certain restrictions, each common unit of Artisan Partners Holdings (together with the corresponding share of Class B or Class C common stock) is exchangeable for a share of our Class A common stock.
•A corporation (“H&F Corp”) merged with and into Artisan Partners Asset Management, which we refer to in this document as the H&F Corp Merger.
•We entered into two tax receivable agreements (“TRAs”), one with a private equity fund (the “Pre-H&F Corp Merger Shareholder”) and the other with each limited partner of Artisan Partners Holdings. Pursuant to the first TRA, APAM pays to the assignees of the Pre-H&F Corp Merger Shareholder a portion of certain tax benefits APAM realizes as a result of the H&F Corp Merger. Pursuant to the second TRA, APAM pays to current or former limited partners of Artisan Partners Holdings (or their assignees) a portion of certain tax benefits APAM realizes as a result of the purchase or exchange of their limited partnership units of Artisan Partners Holdings.
The diagram below depicts our organizational structure as of December 31, 2025:
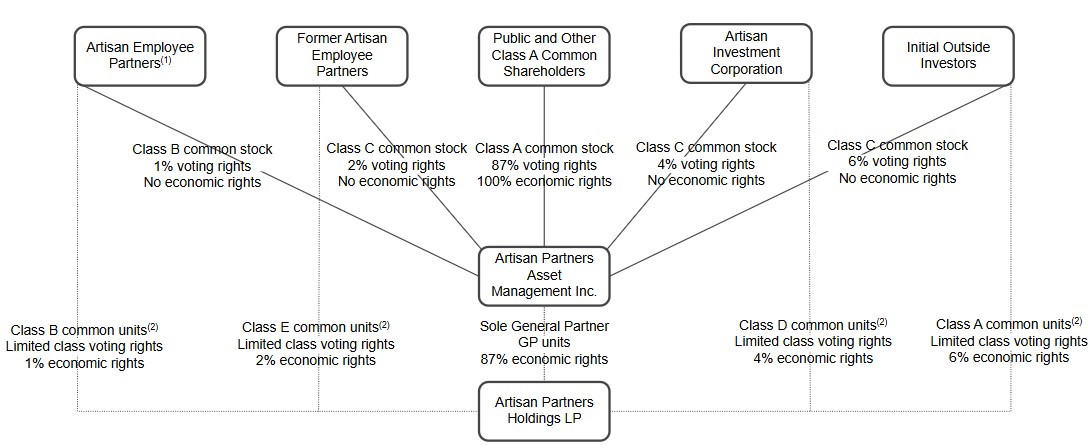
(1) | Our employees to whom we have granted equity have entered into a stockholders agreement with respect to all shares of our common stock they have acquired from us and any shares they may acquire from us in the future, pursuant to which they granted an irrevocable voting proxy to a stockholders committee currently consisting of Jason A. Gottlieb (Chief Executive Officer and President), Eric R. Colson (Executive Chair) and Charles J. Daley, Jr. (Chief Financial Officer). The stockholders committee, by vote of a majority of its members, will determine the vote of all of the shares subject to the stockholders agreement. In addition to owning all of the shares of our Class B common stock, our employee-partners, together with our other employees, owned unvested restricted shares of our Class A common stock representing approximately 7% of our outstanding Class A common stock as of December 31, 2025. | ||||
(2) | Each class of common units generally entitles its holders to the same economic and voting rights in Artisan Partners Holdings as each other class of common units, except that the Class E common units have no voting rights except as required by law. | ||||
12
Available Information
Our website address is www.artisanpartners.com. We make available free of charge through our website all of the materials we file with or furnish to the SEC as soon as reasonably practicable after we electronically file such material with, or furnish it to, the SEC. Information contained on our website is not part of, nor is it incorporated by reference into, this Form 10-K. The company was incorporated in Wisconsin on March 21, 2011 and converted to a Delaware corporation on October 29, 2012.
Item 1A. Risk Factors
Human Capital Risks
The loss of key investment professionals or senior members of our distribution and management teams could have a material adverse effect on our business.
Our success depends on our ability to attract, retain and motivate, including through competitive compensation packages, the portfolio managers who manage our investment strategies and have been primarily responsible for the historically strong investment performance we have achieved. The departure of a portfolio manager has in the past contributed to clients’ decisions to withdraw funds from an investment strategy and could in the future cause clients to withdraw funds or terminate their relationship with us entirely. Such client cash outflows reduce our AUM, and therefore reduce our investment advisory fees and our net income. The departure of a portfolio manager has in the past and could in the future also cause consultants and intermediaries to stop recommending a strategy for a period of time, and clients to refrain from allocating additional funds to a strategy or delay such additional funds until a sufficient new track record has been established. Although we have not been materially impacted by the departure of a portfolio manager to date, we cannot guarantee that any future impacts from departures would not be material, particularly if the departing portfolio manager is responsible for managing a significant percentage of AUM that accounts for a high proportion of our revenues. See “Item 1—Business” in Part I of this report for a breakdown of AUM managed within each investment strategy and the portfolio manager(s) responsible for each strategy.
In addition to our key investment professionals, we also depend on the contributions of our senior management team led by Jason A. Gottlieb and Eric R. Colson, and certain marketing and client service personnel who have direct contact with our institutional clients, consultants, intermediaries and other key individuals within our distribution channels. Despite our efforts to implement succession plans, the loss of any of these key professionals could limit our ability to successfully execute our business strategy or adversely affect our ability to retain existing and attract new client assets and related revenues.
Competition for highly-skilled and motivated portfolio managers and other key investment professionals is intense, and such professionals have an increasing number of employment options beyond traditional asset management firms, including multi-manager platforms, alternative investment firms, family offices and insurance companies. Any of our key professionals may resign at any time, retire, join our competitors or form a competing company. Although many of our portfolio managers and each of our named executive officers are subject to one-year post-employment non-compete obligations, these non-competition provisions are not enforceable in certain jurisdictions or may not be enforceable to their full extent. In addition, we have in the past and may again in the future agree to waive non-competition provisions or other restrictive covenants applicable to former key professionals in light of the circumstances surrounding their relationship with us. We do not carry “key person” insurance that would provide us with proceeds in the event of the death or disability of any of our key professionals.
Changes to our investment environment or compensation structures, or decisions related to resource allocation, could cause instability within our investment teams and/or have an adverse effect on the performance of our investment strategies, our financial results and our ability to grow.
Attracting, developing and retaining talented investment professionals is an essential component of our business strategy. To do so, it is critical that we continue to foster an environment and provide opportunities, compensation and benefits that are attractive for existing and prospective investment professionals within an increasingly complex platform. If we are unsuccessful in maintaining such an environment or compensation levels or structures, for example if the activities we undertake in pursuit of growing new areas of our business impact our ability to simultaneously maintain our traditional equity-focused investment teams and strategies, our existing investment professionals may leave our firm or fail to produce their best work on a consistent, long-term basis and/or we may be unsuccessful in attracting talented new investment professionals, any of which could negatively impact the performance of our investment strategies, our financial results and our ability to grow.
Over our firm’s history we have sought to successfully design and implement compensation structures that align our investment professionals’ economic interests with those of our clients and stockholders. We believe such alignment is important to our long-term growth and that objective, predictable, and transparent compensation structures work best to incentivize investment professionals to perform over the long-term.
With respect to asset-based revenues, each of our investment teams shares a bonus pool consisting of a percentage of the asset-based revenues earned by the strategies managed by the respective team, which is generally set at 25% depending on strategy type. Each team is also entitled to a share of the performance-based revenues earned by the strategies it manages. The revenue share directly links the majority of the investment teams’ cash compensation to long-term growth in revenues, which, over the long-term, we believe is primarily linked to investment performance. We also provide supplemental incentive payments to investment professionals in support of new or subscale teams or strategies or franchise development efforts.
The equity we award to our investment professionals consists of a mix of standard restricted shares which vest pro rata over the five years following the year of grant, and career or franchise shares that generally vest on, or 18 months after, a “qualified
13
retirement” as defined in the applicable award agreement. Franchise shares are further subject to the franchise protection clause, which applies to current or former portfolio managers and founding investment team members. Pursuant to this clause, the number of shares ultimately vesting may be reduced to the extent that cumulative net client cash outflows from the award recipient’s investment team during a period beginning on the date of the recipient’s retirement notice exceeds a set threshold.
We also grant franchise capital awards to investment professionals to enhance the alignment between our investment professionals and clients, and to provide investment professionals with greater control over their long-term economic outcome. Franchise capital awards are cash awards that are subject to the same long-term vesting and forfeiture provisions as the restricted share-based awards described above. Prior to vesting, the franchise capital awards will generally be invested in one or more of the investment strategies managed by the award recipient’s investment team.
We regularly assess the effectiveness of our compensation arrangements and long-term incentive structures in aligning the long-term interests of our investment professionals with those of our clients and stockholders and consider whether different, or modified, arrangements or structures would enhance incentives for long-term growth and succession planning.
The implementation of new or modified compensation arrangements or long-term incentive programs has in the past led to friction within our investment teams. Future modifications to compensation arrangements or long-term incentive programs, or other decisions relating to resource allocation, could cause instability within our investment teams if those modifications or decisions were perceived to negatively impact portfolio managers’ economic outcomes or treated teams differently from one another. In addition, any new arrangements or structures could materially impact our financial performance and results (or expectations about our future financial performance and results), reduce the amount of cash available for dividends and distributions to our stockholders and partners or result in dilution to other stockholders.
Market and Investment Performance Risks
Poor investment performance leads to a loss of AUM which reduces our revenues and negatively impacts our financial condition.
Our financial results are impacted by changes in the total level of our AUM. The performance of our investment strategies is critical in retaining existing client assets and in attracting new client assets. Poor performance, as compared to third-party benchmarks or competitive products, causes financial intermediaries, advisors and consultants to remove our investment products from recommended lists and can result in lower Morningstar and Lipper ratings and rankings. During periods of long-term poor performance, our clients have in the past withdrawn funds from our investment strategies and, in some cases, have decided to end their relationship with us entirely. In addition, our ability to attract new client assets is adversely affected by prolonged periods of poor performance. A decrease in the value of our AUM as a result of poor performance has in the past, and would in the future, have an adverse impact on our revenues, as nearly all of the investment management fees we earn are based on a specified percentage of clients’ average AUM. Poor performance also reduces revenues attributed to performance-based fees.
Our investment strategies can perform poorly for a number of reasons, including general market conditions; investor sentiment about market and economic conditions, as well as investment styles and philosophies; investment decisions; the performance of the companies in which our investment strategies invest and the currencies in which those investments are made; the liquidity of securities or instruments in which our investment strategies invest; our inability to identify sufficient appropriate investment opportunities for existing and new client assets on a timely basis; and our inability to retain key investment professionals and other personnel.
Moreover, even when our strategies experience strong results relative to the market, client allocations to our strategies typically increase relative to their other investments, often resulting in subsequent withdrawals as our clients rebalance their investments to meet their asset allocation preferences despite our strong results.
While clients do not have legal recourse against us solely on the basis of poor investment results, if our investment strategies perform poorly, we are more likely to become subject to litigation brought by dissatisfied clients. In addition, to the extent clients are successful in claiming that their losses resulted from fraud, negligence, willful misconduct, breach of contract, breach of fiduciary duty or similar misconduct, these clients may have remedies against us, the mutual funds and other funds we advise and/or our investment professionals under various U.S. and non-U.S. laws.
Difficult market conditions typically adversely affect our business in many ways, including by reducing our AUM and causing clients to withdraw funds, each of which reduces our revenues and impacts our financial condition.
Financial markets have experienced, and may continue to experience, volatility and disruption amid continued concerns about elevated inflation, uncertainty around the timing and extent of changes in interest rates, economic and trade policy, effects of geopolitical tensions, conflicts and wars, and other global economic conditions. This continued volatility and uncertainty in global financial markets has impacted, and may continue to impact, the value of our AUM. Because the revenue we earn is based on the value of our AUM, fluctuations in our AUM result in corresponding fluctuations in our revenues and earnings. Difficult market conditions have in the past and may in the future cause investors in the mutual funds we advise to redeem their investments in those funds which they can do at any time and without prior notice. Our separate account clients have in the past and may in the future reduce the aggregate amount of AUM with us with minimal or no notice for any reason, including due to deteriorating financial market conditions. In addition, the prices of the securities held in the portfolios we manage have in the past and may in the future decline for any number of reasons beyond our control, including, among others, a declining market, general economic downturn or recession, political uncertainty, inflation rates, interest rates, natural disasters, war, acts of terrorism,
14
social, civil or political unrest, public health crises, changes in trade policies, including the imposition of new or increased tariffs and the economic impact, volatility and uncertainty resulting therefrom, the imposition of economic sanctions or other unpredictable events.
In connection with the severe market dislocations of 2008 and 2009, for example, the value of our AUM declined substantially. In the period from June 30, 2008 through March 31, 2009, our AUM decreased by approximately 43%, primarily as a result of general market conditions. During the first quarter of 2020, AUM levels decreased by approximately 24% from February 19, 2020 to March 31, 2020, as a result of sharp global equity market declines related to the COVID-19 pandemic. More recently, over the course of 2022, our assets declined by approximately 27%, as persistent inflation and efforts by central banks to combat that inflation through increasing interest rates, and the Russian invasion of Ukraine caused widespread turmoil in global financial markets.
The fees we earn under our investment management agreements are typically based on the market value of our AUM, and to a much lesser extent based directly on investment performance. Difficult market conditions have in the past led, and may again lead, to a decline in our AUM, thereby resulting in a decline in our investment advisory fees. If our revenues decline without a commensurate reduction in our expenses, our net income will be reduced.
Several of our investment strategies invest principally in the securities of non-U.S. companies, which involve foreign currency exchange risks and may face heightened tax, political, social, economic and legal risks.
As of December 31, 2025, approximately 48% of our AUM were invested in strategies that primarily invest in securities of non-U.S. companies. Some of our other strategies also invest on a more limited basis in securities of non-U.S. companies. Approximately 50% of our AUM were invested in securities denominated in currencies other than the U.S. dollar at December 31, 2025. Fluctuations in foreign currency exchange rates could negatively affect the returns of our clients who are invested in these strategies. In addition, an increase in the value of the U.S. dollar relative to non-U.S. currencies is likely to result in a decrease in the U.S. dollar value of our AUM, which, in turn, would likely result in lower revenue and profits. See “Qualitative and Quantitative Disclosures Regarding Market Risk-Exchange Rate Risk” in Item 7A of this report for more information about exchange rate risk.
Investments in non-U.S. issuers face heightened tax, political, social, economic and legal risks. Non-U.S. issuers are affected by tax positions taken in countries or regions in which we are invested. Declining tax revenues have in the past and could in the future cause governments to assert their ability to tax the local gains and/or income of foreign investors, which has in the past and could in the future adversely affect clients’ interests in investing outside their home markets.
The price and liquidity of securities traded in non-U.S. markets may be adversely affected by political or economic events, government policies and social or civil unrest within a particular country. For example, in response to Russia’s invasion of Ukraine, the U.S. and other countries imposed broad-ranging economic sanctions on Russia and certain Russian individuals, banking entities and corporations, which has impacted the value and liquidity of Russian holdings. These risks could adversely affect the performance of our strategies that are invested in securities of non-U.S. issuers and may be particularly acute in the emerging or less developed markets in which we invest where markets are often smaller, less liquid, less regulated and significantly more volatile than those in the U.S. In addition to our Sustainable Emerging Markets and Developing World strategies, and the strategies managed by the EMsights Capital Group, which invest primarily in emerging markets, several of our other investment strategies are permitted to invest, and do invest, in emerging or less developed markets to a more limited extent.
Competition and Distribution Risks
We may not be able to maintain our current fee rates as a result of poor investment performance, competitive pressures, changes in global markets and asset classes, changes in our business mix or for other reasons, which could have a material adverse effect on our profit margins and results of operations.
We may not be able to maintain our current fee rates for any number of reasons, including as a result of poor investment performance, competitive pressures, changes in global markets and asset classes or as a result of changes in our business mix. Although our investment management fees vary by client, investment strategy and investment vehicle, we historically have been successful in maintaining an attractive overall rate of fee and profit margin due to the strength of our investment performance and our focus on high value-added investment strategies. However, the general trend toward lower fees in the investment management industry as a result of competition and regulatory and legal pressures continues. In order to maintain our fee structure in a competitive environment, we must retain the ability to decline additional assets to manage from potential clients who demand lower fees even though our revenues may be adversely affected in the short term. In addition, we must be able to continue to provide clients with investment returns and service that our clients believe justify our fees.
From time to time, we offer lower fees in order to retain current, and attract additional, assets to manage. We also make fee concessions in certain circumstances, for example in order to attract early investors in a new strategy or increase marketing momentum in a strategy. Downward pressure on fees results from additional factors, including the growth and evolution of the universe of potential investments in a market or asset class or by transformative pressures impacting the investment management industry, such as the continued growth of allocations to passive and alternative investment options. Changes in how clients choose to access asset management services also exert downward pressure on fees. Some investment consultants, for example, have implemented programs in which the consultant provides a range of services, including selection, in a fiduciary capacity, of asset managers to serve as sub-adviser at lower fee rates than the manager’s otherwise applicable rates, with the expectation of a
15
larger amount of AUM through that consultant. The expansion of those and similar programs could, over time, make it more difficult for us to maintain our fee rates. In addition, from time to time, plan sponsors of 401(k) and other defined contribution assets that we manage choose to invest plan assets in vehicles with lower cost structures than mutual funds (such as a collective investment trust) or may choose to access our services through a separate account. We provide fewer services to collective investment trusts and separate accounts than we provide to Artisan Funds and we receive fees at lower rates.
The investment management agreements pursuant to which we advise mutual funds are subject to an annual process of review and renewal by the funds’ boards. As part of that process, the fund board considers, among other things, the level of compensation that the fund has been paying us for our services. That process may result in the renegotiation of our fee structure or an increase in the cost of the performance of our obligations. Any fee reductions on existing or future new business would have an adverse effect on our profit margins and results of operations.
We depend on third parties to market our investment strategies.
Our ability to attract additional assets to manage is highly dependent on our access to third-party intermediaries. We gain access to investors primarily through consultants and other third parties that advise institutional clients, as well as through 401(k) and mutual fund platforms, brokerage firms, private banks, trust companies, financial advisors and other financial intermediaries through which shares of our funds are sold or that offer our investment products to their clients. We have relationships with some third-party intermediaries through which we access clients in multiple distribution channels. Our two largest intermediary relationships across multiple distribution channels each represented approximately 9% of our total AUM as of December 31, 2025.
Certain of our intermediaries through which we distribute our mutual funds also sell their own funds and technology-enabled investment solutions. Investment products offered by intermediaries may have lower fees and be provided in more tax efficient wrappers, which could limit the distribution of our investment strategies that are offered through more traditional vehicles. Certain intermediaries have reduced the number of investment options they make available to their clients and/or are seeking to reduce the number of investment management firms with whom they work. Any failure to maintain strong business relationships with these intermediaries due to any of the above-described factors would impair our ability to sell our products, which in turn could have a negative effect on our AUM, revenues and net income.
We compensate most of the intermediaries through which we gain access to investors in Artisan Funds by paying fees, most of which are a percentage of assets invested in Artisan Funds through that intermediary and with respect to which that intermediary provides shareholder and administrative services. The allocation of such fees between us and Artisan Funds is determined by the Artisan Funds’ board, based on information and a recommendation from us, with the goal of allocating to us, at a minimum, all costs attributable to marketing and distribution of shares of Artisan Funds. In the future, our expenses in connection with those intermediary relationships could increase if the portion of those fees determined to be in connection with marketing and distribution, or otherwise allocated to us or payable by us, increased.
We access institutional clients primarily through consultants upon whose referrals our institutional business is highly dependent. These consultants review and evaluate our products and our firm from time to time. As of December 31, 2025, the investment consultant advising the largest portion of our AUM represented approximately 4% of our total AUM. Poor reviews or evaluations of us or a particular strategy may result in client withdrawals or may impair our ability to attract new assets through these consultants.
The investment management industry is intensely competitive and experiencing transformative pressures. Failure to address these transformative pressures and remain competitive could negatively impact our business.
Competition within the investment management industry is based on a variety of factors, including investment performance, management fee rates, continuity of investment professionals and client relationships, the quality of client service, corporate positioning and business reputation, continuity of distribution arrangements with intermediaries and product mix and offerings. In addition, the investment management industry is facing transformative pressures and trends from a variety of different sources including continued fee pressure; a continued shift away from actively managed equity strategies towards alternative, passive and smart beta strategies; increased demands from clients and distributors for client engagement and services; a trend towards intermediaries developing fewer relationships and partners and reducing the number of investment managers they work with; and advances in technology and digital wealth and distribution tools. A number of factors, including the following, serve to increase our competitive risks:
•Unlike some of our competitors, we do not currently engage in impact investing, offer passive investment strategies or “solutions” products like target-date funds.
•A number of our competitors have greater financial, technical, marketing and other resources, more comprehensive name recognition and more personnel than we do.
•Potential competitors have a relatively low cost of entering the investment management industry.
•Some investors may prefer to invest with an investment manager that is not publicly traded based on the perception that a publicly-traded asset manager may focus on the manager’s own growth to the detriment of investment performance.
•Other industry participants may seek to recruit our investment professionals.
•Many competitors charge lower fees for their investment management services than we do.
16
•The majority of our investment strategies are traditional active equity products, compared to alternative products where investor allocations continue to grow.
For example, the trend in favor of low-fee passive products such as index and certain exchange-traded funds favors those of our competitors who provide passive investment strategies. That trend has presented, and likely will continue to present, a headwind to our business. If we are unable to compete effectively, our earnings would be reduced and our business could be materially adversely affected.
As a result of the trends and pressures discussed above, the asset management industry is facing an increased level of disruption. If we are unable to adapt our business strategy to adequately address these trends and pressures, we may be unable to meet client needs satisfactorily, our competitive position may weaken, and our business results and operations may be adversely affected.
Risks Related to our Business
Our efforts to establish and develop new teams, strategies and vehicles, or pursue other strategic transactions, may face challenges or ultimately be unsuccessful, which could impact our results of operations, reputation and culture.
We seek to recruit new investment teams that manage high value-added investment strategies and allow us to grow strategically. We also look to develop new, differentiated strategies or vehicles managed by our existing teams. We expect the costs associated with establishing a new investment team, strategy or vehicle to initially exceed the revenues generated, which negatively impacts our results of operations. New strategies or vehicles, whether managed by a new team or by an existing team, can and do make investments or present operational, legal, regulatory or distribution-related issues and risks that we have not yet encountered or with which we have less experience. The incorporation of new teams, strategies, vehicles and types of investments could strain our resources and increase the likelihood of an error or failure, a risk which is exacerbated by the increasingly complex and specialized nature of newer investment teams and strategies. The establishment of new teams or strategies, in particular, alternative-focused investment teams or strategies, may also cause us to make changes to our traditional compensation and economic model, which could reduce our profitability and harm our firm’s culture.
Historical returns of our existing investment strategies will not be indicative of the investment performance of any new strategy and new strategies may have higher performance expectations that are more difficult to meet. Poor performance of any new strategy could negatively impact our reputation and the reputation of our other investment strategies.
We generally support the development of new strategies by making one or more seed investments or capital commitments using capital that would otherwise be available for our general corporate purposes. Making such investments exposes us to capital losses and reduces the amount of capital available for other purposes. In addition, the development of new investment teams and strategies requires the support of well-qualified investment, distribution and operational talent, the market for which has been and may continue to be tight. The inability to recruit or retain such personnel may negatively impact our ability to develop investment teams and strategies and may ultimately hinder our growth.
From time to time, we also consider other strategic opportunities, including potential acquisitions or similar transactions, which may impact our business. In January 2026, we completed our first acquisition with the purchase of Grandview Property Partners and began a phased integration designed to minimize disruption to operations and stakeholders. We cannot be certain that we will be able to identify and successfully complete such transactions in the future, and no assurance can be given with respect to the timing, likelihood or business effect of any possible transaction. These initiatives, including the acquisition of Grandview, typically involve a number of risks and present financial, managerial and operational challenges to ongoing business operations. Such risks include the required investment of capital and other resources; unanticipated problems regarding integration and oversight of a new business, additional or new regulatory requirements, operating facilities and technologies and new employees; distracting management and other key personnel from our existing businesses; and the existence of liabilities or contingencies not disclosed to or otherwise known by us prior to closing a transaction. There is no guarantee we will realize the anticipated benefits from any such transactions in a timely manner, if at all.
We derive substantially all of our revenues from contracts and relationships that may be terminated upon short or no notice.
We derive substantially all of our revenues from investment management agreements, all of which are terminable by clients upon short or no notice. Our investment management agreements with U.S. registered mutual funds, as required by law, are generally terminable by the funds’ boards or a vote of a majority of the funds’ outstanding voting securities on not more than 60 days’ written notice. After an initial term, each fund’s investment management agreement must be renewed annually by that fund’s board, including by its independent members. In addition, all of our separate accounts and some of the mutual funds that we sub-advise have the ability to re-allocate all or any portion of the assets that we manage away from us at any time with little or no notice. The decrease in revenues that could result from the termination of a material client relationship or the re-allocation of assets away from us could have a material adverse effect on our business.
Investors in many of the funds we advise can redeem their investments at any time without prior notice or with fairly limited notice, which would reduce our AUM and could adversely affect our earnings.
Investors in the mutual funds, UCITS funds, and some other pooled investment vehicles that we advise may redeem their investments in those funds at any time without prior notice. Investors in certain other pooled vehicles may redeem their investments with fairly limited prior notice. Investors may redeem for any number of reasons, including general financial market conditions, the absolute or relative investment performance we have achieved or their own financial condition and requirements.
17
In a declining stock market, the pace of redemptions could accelerate. Redemptions reduce our AUM and adversely affect our revenues.
The majority of our AUM are managed in primarily long-only, equity investment strategies, which exposes us to greater risk than certain of our competitors who may manage more assets in diverse strategies.
Our investment strategies that we classify as being within the equity asset class accounted for approximately 88% of our AUM as of December 31, 2025. Under market conditions in which there is a general decline in the value of equity securities, the AUM in each of these strategies is likely to decline. Although certain strategies have the ability to take short positions in equity securities, such investments have not typically been made in practice. In addition, there is no guarantee that such short positions would meaningfully offset the poor performance of our long-only equity strategies under such market conditions. Even if our investment performance remains strong during such market conditions relative to other long-only, equity strategies, investors may choose to withdraw assets from our management or allocate a larger portion of their assets to non-long-only or non-equity strategies. In addition, the prices of equity securities may fluctuate more widely than the prices of other types of securities, making the level of our AUM and related revenues more volatile.
Our credit and alternative investment strategies present investment, operational, distribution and other risks that are different in kind and/or degree from those presented by our earlier investment strategies and dealing with those risks presents us with new challenges.
Our credit and alternative investment strategies have the ability to make investments that present different risks and/or degrees of risk than our earlier strategies, many of which invest primarily in publicly traded equity securities. For example, several of our newest strategies invest in securities that are not publicly traded. We may be prohibited from selling these investments for a period of time and generally will be unable to sell these securities publicly unless their sale is registered under applicable securities law or an exemption from such registration is available. Illiquid securities are more difficult to value and dispose of when desired and, under certain circumstances, may make it more difficult to manage investors’ redemption requests. Several of our existing strategies, and strategies we may offer in the future, can and do invest in certain instruments (such as derivative securities) and engage in activities (such as shorting and use of leverage) the complexity of which may increase the risk of operational errors. Any such errors could damage our reputation or result in regulatory scrutiny or legal liability. In addition, any real or perceived problems could cause a disproportionate negative impact on our business and reputation.
Several of our newer investment strategies are primarily offered through private funds, which present operational, regulatory and distribution-related risks that are different from those associated with the mutual funds and traditional separate accounts through which we offer our earlier investment strategies. In the future, we expect to offer investment strategies through different types of investment vehicles and fund structures which could present different types of operational, regulatory and distribution-related risks with which we have little to no experience. For example, our reputation as a long-only manager of traditional investment products has been an impediment to penetrating new channels and selling our newer alternative investment strategies. Although we continue to build out a team of distribution professionals with deep alternatives experience and strong fundraising networks, we cannot be sure that these changes will have a meaningful impact on selling our alternatives strategies. In general, the complexity of these newer strategies and vehicles could strain our resources and increase the likelihood of real or perceived problems, which could damage our reputation or result in regulatory scrutiny or legal liability.
Several of our newer investment strategies and vehicles, and strategies and vehicles that we may establish in the future, have more limited capacity than our earlier large-capacity investment strategies. Despite the limited capacity, these newer strategies with broader degrees of freedom may require increased access to specialized technology, market data with advanced data analytic capabilities, and operational resources, including bespoke operational solutions and third-party service providers as well as operational, distribution and other personnel with specialized talent to align with the increasing complexity of the investment strategies. In addition to the risk that our newer investment teams, strategies or vehicles may not experience the requisite growth to compensate for these increased operational support costs, requests for resources that are disproportionate to the size of the investment team may put pressure on our resource allocation model and cause friction and instability among the teams. Friction among investment teams may also occur if these newer strategies with broader degrees of freedom take action or make investments that ultimately impact the ability of our other investment teams to invest in a manner consistent with their philosophy and process. Friction and distraction within our investment teams may cause our existing investment professionals to leave our firm or fail to produce their best work on a consistent, long-term basis and/or we may be unsuccessful in attracting talented new investment professionals, any of which could negatively impact the performance of our investment strategies, our financial results and our ability to grow.
If our techniques for managing risk are ineffective, we may be exposed to material unanticipated losses.
In order to manage the significant risks inherent in our business, we must maintain effective policies, procedures and systems that enable us to identify, monitor and mitigate our exposure to operational, legal and reputational risks. Our risk management methods may prove to be ineffective due to their design or implementation, or as a result of a lack of adequate, accurate or timely information or otherwise. If our risk management efforts are ineffective, we could suffer losses that could have a material adverse effect on our operating results or financial condition. Additionally, we could be subject to litigation, particularly from our clients or investors, and sanctions or fines from regulators.
We may, from time to time, strategically manage our exposure to market, interest or exchange rate risks on our own behalf or on behalf of our clients. However, because our clients invest in our investment strategies in order to gain exposure to the portfolio
18
securities of the respective strategies, we have not adopted corporate-level risk management policies to manage market, interest rate or exchange rate risks that would affect the value of our overall AUM.
We provide a range of services to Artisan Funds, Artisan Global Funds, Artisan Private Funds and sub-advised funds which may expose us to liability.
We provide a broad range of administrative services to Artisan Funds, including providing personnel to serve as directors and officers of Artisan Funds and to serve on the valuation and liquidity committee of Artisan Funds. We prepare or supervise the preparation of Artisan Funds’ regulatory filings and financial statements, and manage compliance and regulatory matters. We provide shareholder services, accounting services including the supervision of the activities of Artisan Funds’ accounting services provider in the calculation of the funds’ net asset values, and tax services including calculation of dividend and distribution amounts. We also coordinate the audits of financial statements and supervise tax return preparation. Although less extensive than the range of services we provide to Artisan Funds, we provide a range of similar services to Artisan Global Funds and Artisan Private Funds. In addition, from time to time we provide information to other funds we advise (or to an entity providing services to such a fund) which may be used by those funds in their efforts to comply with various regulatory requirements.
The services we provide to Artisan Funds, Artisan Global Funds, Artisan Private Funds, and other funds we advise may expose us to liability. For example, if we make a mistake in the provision of such services, a fund could incur costs for which we might be liable. If it were determined that a fund failed to comply with applicable regulatory requirements as a result of our action or our employees’ failure to act, we could be responsible for losses suffered or penalties imposed. In addition, we could have penalties imposed on us, be required to pay fines or be subject to private litigation, any of which could decrease our future income or negatively affect our current business or our future growth prospects.
Our real estate funds are subject to the risks inherent in the ownership and operation of real estate and the construction and development of real estate.
Investments by our real estate funds will be subject to the risks inherent in the ownership and operation of real estate and real estate-related businesses and assets. Such investments are subject to the potential for deterioration of real estate fundamentals and the risk of adverse changes in local market and economic conditions, which may include changes in supply of and demand for competing properties in an area, increases in interest rates and borrowing costs, changes in demand for properties, changes in the financial resources of tenants, defaults by borrowers or tenants and the reduced availability of mortgage funds, which may render the sale or refinancing of properties difficult or impracticable. In addition, investments in real estate and real estate-related businesses and assets may be subject to the risk of environmental liabilities, contingent liabilities upon disposition of assets, casualty or condemnations losses, energy and supply shortages, natural disasters, climate change related risks, acts of god, terrorist attacks, war, pandemics or other severe public health events, and other events that are beyond our control, and various uninsured or uninsurable risks. Further, investments in real estate and real estate-related businesses and assets are subject to changes in law and regulation, including in respect of building, environmental and zoning laws and changes to tax laws and regulations.
Risks Related to Legal or Regulatory Factors and Taxation
Failure to properly address conflicts of interest could harm our reputation or cause clients to withdraw funds, each of which could adversely affect our business and results of operations.
The SEC and other regulators have continued to focus on potential conflicts of interest and our fiduciary duties as an adviser. We have implemented procedures and controls that we believe are reasonably designed to address these issues. However, appropriately dealing with conflicts of interest is complex and if we fail, or appear to fail, to deal appropriately with conflicts of interest, we could face reputational damage, litigation or regulatory proceedings or penalties, any of which may adversely affect our results of operations.
As we expand the scope and complexity of our business and client base, we must continue to monitor and address any conflicts between the interests of our stockholders and those of our clients. Our clients may withdraw funds if they perceive conflicts of interest between the investment decisions we make for strategies or vehicles in which they have invested and our obligations to our stockholders. For example, we may limit the growth of assets in or close strategies when we believe it is in the best interests of our clients even though our AUM and investment advisory fees may be negatively impacted in the short term. Similarly, we may establish new investment teams, strategies or vehicles or expand operations into new geographic areas if we believe such actions are in the best interests of our clients, even though our profitability may be adversely affected in the short term. Although we believe such actions enable us to retain client assets and maintain our profitability, which benefits both our clients and stockholders, if clients perceive a change in our investment or operations decisions in favor of a strategy to maximize short-term results, they may withdraw funds, which could reduce our revenue and impact our financial condition.
Offering private funds also poses risks associated with side-by-side management and the potential for real or perceived conflicts of interest, which, if not managed correctly, could cause reputational harm, regulatory scrutiny or litigation. We have established policies and procedures to manage potential conflicts of interest associated with side-by-side management. However, we are unable to completely eliminate the potential for real or perceived conflicts of interest.
19
Our failure to comply with clients’ investment guidelines and applicable legal limitations could result in damage awards against us and a loss of AUM, either of which could adversely affect our reputation and financial condition.
When clients retain us to manage assets on their behalf, they generally specify certain investment guidelines that we are required to follow. In addition, some of our clients are subject to laws that impose restrictions and limitations on the investment of their assets. For example, U.S. mutual fund assets that we manage must be invested in accordance with limitations under the 1940 Act and applicable provisions of the Internal Revenue Code of 1986, as amended. Our failure to comply with any of these guidelines and other limitations could result in losses to clients or fund investors which, depending on the circumstances, could result in our obligation to reimburse such clients or fund investors. If we believed that the circumstances did not justify a reimbursement, or clients and investors believed the reimbursement we offered was insufficient, they could seek to recover damages from us or could withdraw assets from our management or terminate their investment management agreement with us. Any of these events could harm our reputation and adversely affect our business.
Employee misconduct, or perceived misconduct, could expose us to significant legal liability and/or reputational harm.
We are vulnerable to reputational harm because we operate in an industry in which integrity and the confidence of our clients are of critical importance. Our employees, or third parties with whom we are affiliated, could engage in misconduct, or perceived misconduct, that adversely affects our business. It is not always possible to deter employee misconduct and the precautions we take to prevent and detect this activity may not always be effective. Misconduct or perceived misconduct by our employees, or even unsubstantiated allegations of such conduct, could cause serious damage to our reputation, resulting in the loss of clients and an adverse effect on our revenues. Employee misconduct could also subject us to regulatory scrutiny and legal liability.
The expansion of our business outside of the United States raises tax and regulatory risks, may adversely affect our profit margins and places additional demands on our resources and employees.
We continue to expand our distribution efforts into non-U.S. markets. The number of client relationships outside the U.S. has grown from 91 as of December 31, 2015 to 234 as of December 31, 2025. Costs related to our distribution efforts in non-U.S. markets have often been more expensive than comparable costs in the U.S. and our non-U.S. clients may be accustomed to certain practices that differ from and may conflict with practices that are customary in the U.S. For example, the use of soft dollars for research products and services are generally accepted in the U.S. However, other jurisdictions (for example, the European Union) have requirements that limit or prohibit the use of soft dollars for research products and services. Such conflicting practices add complexity, costs and risk to our non-U.S. client relationships.
While a majority of our operations take place in the U.S., we do maintain offices in a number of other countries including the U.K., Ireland, Singapore, Australia and Hong Kong. Operating our business in non-U.S. markets is generally more expensive than in the U.S. for a number of reasons, including differences in tax and regulatory regimes. To the extent that our revenues do not increase to the same degree our expenses increase in connection with our continuing expansion outside the U.S., our profitability could be adversely affected. Expanding our business into new markets may also place significant demands on our existing operational infrastructure and on our existing employees.
Our employees routinely travel inside and outside the U.S. as a part of our investment research process, to market our services and to supervise and manage our business. Their activities in the jurisdictions they travel to on our behalf may raise both tax and regulatory issues. If and to the extent we are incorrect in our analysis of the applicability or impact of these tax or regulatory requirements, we could incur costs, penalties or be the subject of an enforcement or other action.
Changes in tax laws or exposure to additional tax liabilities could have a material impact on our financial condition, results of operations and liquidity.
We are subject to income taxes, as well as non-income based taxes, in both the U.S. and certain foreign jurisdictions at various levels of government. We cannot predict future changes in the tax laws, regulations, administrative guidance or judicial decisions to which we are subject or that could apply to our business. Any such changes could have a material impact on our tax liability, materially impact our effective tax rate, result in additional tax reporting obligations or result in increased costs associated with our tax compliance efforts.
From time to time, we are subject to income and non-income based tax audits in the jurisdictions in which we operate. The calculation of our tax liabilities involves dealing with uncertainties in the application of complex tax rules and regulations in a number of jurisdictions. From time to time, tax authorities have disagreed with certain positions we have taken which has resulted in additional taxes and, in certain cases interest payments. In the future, such instances may result in additional taxes, interest, fines and penalties becoming due. We evaluate whether to record tax liabilities for possible tax audit issues based on our estimate of whether, and the extent to which, additional income taxes will be due. We adjust these liabilities in light of changing facts and circumstances and consultations with our outside tax advisors. However, due to the complexity of some of these uncertainties, the ultimate resolution may result in a payment that is materially different from our estimates.
We are subject to extensive, complex and sometimes overlapping laws, rules and regulations that are subject to continual change.
The industry in which we operate is subject to extensive, complex and overlapping or conflicting laws, rules and regulations. There is uncertainty associated with the regulatory and compliance environments in which we operate and such environments are subject to frequently changing and often increasingly strict rules, regulations, policies, legal interpretations and enforcement
20
approaches around the world. We are subject to extensive regulation in the United States, primarily at the federal level, including regulation by the SEC, the U.S. Department of Labor, the Financial Industry Regulatory Authority, the Commodity Futures Trading Commission and the National Futures Association. Our business is also subject to the laws and regulations of the various countries in which we conduct distribution or investment management activities. It is impossible to determine the extent of the impact of any new laws, regulations or initiatives that may be proposed, or whether any such proposals will become law. Compliance with any new laws or regulations, or changes in the interpretation or enforcement of existing laws or regulations, could be difficult and expensive and affect the manner in which we conduct business. For a more extensive discussion of certain laws and regulations to which we are subject, see “Item 1—Business—Regulatory Environment and Compliance” in Part I of this report.
As a result of the extensive and complex regulatory environment in which we operate, we face risk of regulatory actions and litigation, which could consume substantial expenditures of time and capital. Our regulatory and compliance obligations impose significant operational and cost burdens on us and cover a broad range of topics including, investment advisory matters, securities and other financial instruments, financial reporting and other disclosure matters, sustainability, accounting, tax, cybersecurity and data protection, and privacy. As our business expands into new geographic regions and introduces new, more complex investment products with expanded degrees of freedom, the regulatory requirements to which we are subject will increase in number. While we have focused significant attention and resources on the development and maintenance of compliance policies, procedures and practices, any inadvertent non-compliance with applicable laws, rules or regulations, either in the U.S. or abroad, could result in various legal proceedings, including civil litigation and regulatory investigations and enforcement actions that could result in fines, suspensions of individual employees or limitations on particular business activities, any of which could have an adverse impact on our reputation and business.
We carry insurance in amounts and under terms that we believe are appropriate. Our insurance does not cover all liabilities and losses to which we may be exposed. Certain insurance coverage may not be available or may be prohibitively expensive in future periods. As our insurance policies come up for renewal, we may need to assume higher deductibles or pay higher premiums, which could have an adverse impact on our results of operations and financial condition.
The investment management industry faces substantial litigation risks which could materially adversely affect our business, financial condition or results of operations or cause significant reputational harm to us.
We depend to a large extent on our network of relationships and on our reputation in order to attract and retain client assets. We make investment decisions on behalf of our clients that could result in substantial losses to them. If our clients suffer significant losses, or are otherwise dissatisfied with our services, we could be subject to legal liability or actions alleging negligence, breach of fiduciary duty, breach of contract, unjust enrichment and/or fraud. These risks are often difficult to assess or quantify and their existence and magnitude often remain unknown for substantial periods of time, even after an action has been commenced.
We may incur significant legal expenses in defending against litigation whether or not we engaged in conduct as a result of which we might be subject to legal liability. In addition, we may be obligated, and under our certificate of incorporation, bylaws and indemnification agreements we have entered are obligated under certain conditions, or may choose, to indemnify directors, officers or other personnel against liabilities and expenses they may incur in connection with such matters to the extent permitted under applicable law. These obligations may pose substantial risks to our financial condition, if we are not able to maintain insurance covering such losses or if claims are in excess of our coverage. Substantial legal liability or significant regulatory action against us could materially adversely affect our business, financial condition or results of operations or cause significant reputational harm to us.
A change of control could result in termination of our investment management agreements with mutual funds and could trigger consent requirements in our other investment management agreements.
Under the 1940 Act, each of the investment management agreements between SEC-registered mutual funds and our subsidiary, Artisan Partners Limited Partnership, will terminate automatically in the event of its assignment. Upon the occurrence of such an assignment, our subsidiary could continue to act as adviser to any such fund only if that fund’s board and shareholders approved a new investment management agreement, except in the case of certain funds that we sub-advise for which only board approval would be necessary. In addition, as required by the Advisers Act, each of the investment management agreements for the separate accounts we manage provides that it may not be assigned, as defined in the Advisers Act, without the consent of the client. An assignment occurs under the 1940 Act and the Advisers Act if, among other things, Artisan Partners Limited Partnership undergoes a change of control as recognized under the 1940 Act and the Advisers Act. If such an assignment were to occur, we cannot be certain that we would be able to obtain the necessary approvals from the boards and shareholders of the mutual funds we advise or the necessary consents from our separate account clients.
21
Operational, Technology and Cybersecurity Risks
We depend on a variety of systems to operate and any failures of or damage to those systems, or those of third parties with which we do business, may disrupt our operations, result in losses, damage our reputation or limit our growth.
We are heavily dependent on the capacity and reliability of the communications and information technology systems supporting our operations, whether developed, owned and operated by us or by third parties. We also rely on manual workflows and a variety of manual user controls. As our clients, physical locations and investment teams and strategies increase in number and grow in complexity, and as our employees become increasingly mobile, developing and maintaining the systems supporting our operations becomes increasingly challenging. Moreover, the introduction of new technologies, such as artificial intelligence, presents new challenges and introduces operational and legal risks. Operational issues or errors or interruption or failure of our financial, trading, compliance and other data processing systems, whether caused by human error, power or telecommunications failure, disruptive cyber threats, severe weather events, natural disaster, fire, act of terrorism or war, pandemics or other unpredictable events, could result in a disruption of our business, liability to clients, regulatory intervention or reputational damage, and thus adversely affect our business. In addition, as a global firm with remote work capabilities, we have an increased dependency on remote equipment and connectivity infrastructure to access critical business systems that may be subject to failure, disruption or unavailability that could negatively impact our business operations. The potential for some types of operational risks, including trading errors, may increase in periods of increased volatility, which can magnify the cost of an error. We have back-up systems and a business continuity plan in place, however, these arrangements may not be adequate in the event of a significant interruption or failure of the systems or operations that are critical to our business, however caused. Although we have not suffered material operational errors, including material trading errors, in the past, we may experience such errors in the future, the losses related to which we would absorb. Insurance and other safeguards might not be available or might only partially reimburse us for our losses.
We rely on a number of key vendors for trading, middle- and back-office functions, various fund administration, accounting, custody and transfer agent roles and other operational needs. These key vendors may themselves rely on third party service providers to support their own operations. The failure of any key vendor, or of any service provider to a key vendor, to fulfill its obligations could cause operational issues that could lead to legal liability, regulatory issues, reputational harm and financial losses, the likelihood of which increases as we increase reliance on third-party service providers. Some of the key service providers and vendors upon which we rely operate in a remote or hybrid environment, which subjects both us and third-party service providers and key vendors to risk of operational issues and interruptions as well as to a heightened risk of disruptive cyber threats or other privacy or data security incidents. We and our service providers are also subject to the risk that employees or contractors, or other third parties, may deliberately seek to circumvent established controls to commit fraud or act in ways that are inconsistent with our or their controls, policies, and procedures, and which may be harder to monitor in remote working environments. The financial and reputational impact of control failures can be significant. Moreover, as we grow our operations in new geographic regions, the potential for particular types of political, economic or infrastructure instabilities, information, technology or cyber threats or other country- or region-specific business continuity risks increases.
Any significant failure of, damage to or attack on our information security infrastructure, software applications or other systems that are critical to our operations could disrupt our business, damage our reputation and result in regulatory penalties or other additional costs to us.
We are heavily reliant upon internal and third party technology systems, networks and applications to view, process, transmit and store information, including sensitive client and proprietary information, and to conduct many of our business activities and transactions with our clients, vendors and other third parties. In addition, in recent years we have increased our use of and reliance on mobile, remote work and cloud technologies. Maintaining the integrity of these systems, networks and technologies is critical to the success of our business operations. We rely on our (and our vendors’) information security and cybersecurity infrastructure, policies, procedures and capabilities to protect these systems, networks and applications and the data that reside on or are transmitted through them.
To date, we have not experienced any known material breaches of or interference with our systems, networks or applications, nor to our knowledge have we been materially impacted by a breach of our vendors’ systems, networks or applications. However, we routinely encounter and address such threats, and the number and frequency of potential threats or security incidents experienced by us directly, or indirectly via our vendors, has increased in recent years due to, among other factors, an increase in vulnerability exploitation, more sophisticated cyber threats, proliferation of cloud-based solutions, our increased operations in certain non-U.S. jurisdictions and the increase in remote work. Our experiences with cybersecurity and other technology threats have included phishing scams, introductions of malicious software, attempts at electronic break-ins, brand infringements or impersonations, ransomware and unauthorized payment requests.
Despite the measures we have taken and may in the future take to address and mitigate cybersecurity and other technology risks, which are discussed further in “Item 1C—Cybersecurity” in Part I of this report, we cannot guarantee that our systems, networks and applications, and those of third parties on whom we rely, will not be subject to disruptions, system failures or outages, unauthorized access, cybersecurity incidents or other interference. In addition, our third-party service providers and other intermediaries with which we conduct business and transmit data have in the past been, and may in the future be, subject to successful cybersecurity incidents or other data security events, and, despite our service provider oversight processes and practices, we cannot ensure that such third parties, or the service providers to such third parties, have appropriate controls in place to protect the confidentiality of data in the custody of such party or to allow them to continue their business operations, including the provision of their services to us. In addition, our reliance on third-party vendors and service providers that use artificial
22
intelligence (AI), and the use of AI by other market participants, may increase our exposure to operational, cybersecurity, privacy and reputational risks.
Cybersecurity and information security events may result in operational disruptions as well as unauthorized access to or the disclosure, corruption or loss of our proprietary information or our clients’ or employees’ information. Any such events may result in legal claims, regulatory scrutiny and liability, reputational damage, the incurrence of costs to eliminate or mitigate further exposure, the loss of clients or other damage to our business. Ultimately, such an event may have a material adverse impact on our business, financial condition or results of operations. In addition, required public notification of such incidents could exacerbate the harm to our business, financial condition or results of operations. Even if our and our service providers’ technology infrastructure and the confidentiality of sensitive data are successfully protected, we may incur significant expense in connection with our response to any such cybersecurity incident and the adoption and maintenance of additional security measures. We cannot be certain that future advances in criminal capabilities, the discovery of new vulnerabilities or other developments will not compromise or circumvent the security measures protecting the networks, systems and applications we use.
Our ability to manage and grow our business successfully can be impeded by systems and other technological limitations.
Our continued success in effectively managing and growing our business depends on our ability to integrate our varied financial, information, and operational systems on a global basis. Moreover, adapting or developing the existing systems we use to meet our internal needs, as well as client needs, industry demands and new regulatory requirements, is also critical for our business. On an ongoing basis, we need to upgrade and improve our technology, including the systems that support our core investment, trading and operational activities. Further, we also must be prepared to implement new technology when growth opportunities present themselves, whether in connection with the needs of a current or future investment team or rapidly increasing business activities in particular markets or regions. The integration of new or modified systems could present operational issues or require significant capital, and may require us to reevaluate the current value or expected useful lives of the technology we use or intend to use, which could negatively impact our results of operations. In addition, technology is subject to rapid advancements and changes and our competitors may, from time to time, implement newer technologies or more advanced platforms for their services and products, which could adversely affect our business if we are unable to remain competitive.
Developing regulatory treatment of AI, and failure to adequately address AI-related challenges, creates a risk of reputational harm and an impediment to growth.
AI is used within our business and we plan to further incorporate it where opportunity exists. The use of AI offers efficiencies, but also introduces significant challenges related to data security, privacy, intellectual property, regulatory compliance, accuracy and bias concerns, and reputational harm, among others. For example, AI technologies, including generative AI, may create content that appears correct but is factually inaccurate or flawed. AI technologies evolve at a rapid pace and their usage requires integration with other technology applications, data platforms and business processes. Globally, courts and regulatory agencies are developing approaches to dealing with AI-related issues, which creates uncertainty around the use of the technology. Use of AI technologies requires ongoing operational controls and procedures, and the development and implementation of appropriate protections and safeguards. Failure to successfully integrate AI technologies, respond to client or market demands, identify or address applicable legal or regulatory issues or effectively manage related risks could result in legal and regulatory liabilities and harm our reputation and growth.
Indebtedness Risks
Our indebtedness may expose us to material risks.
We have indebtedness outstanding in the amount of $190 million in unsecured notes, which exposes us to risks associated with the use of leverage. In addition, we maintain a $100 million revolving credit agreement, though no amounts are outstanding as of the date of this filing. Our indebtedness may make it more difficult for us to withstand or respond to adverse or changing business, regulatory and economic conditions or to take advantage of new business opportunities or make necessary capital expenditures. To the extent we service our debt from our cash flow, such cash will not be available for our operations or other purposes. Because our debt service obligations are fixed, the portion of our cash flow used to service those obligations could become substantial if our revenues decline or our expenses increase significantly.
Our Series E, Series F and Series G notes bear interest at a rate equal to 4.53%, 3.10%, and 5.43% per annum, respectively. The fixed interest rate on each of the notes is subject to a 100 basis point increase in the event Holdings receives a below-investment grade rating. Each series requires a balloon payment at maturity. Our ability to repay the principal amount of our notes or any outstanding loans under our revolving credit agreement, to refinance our debt or to obtain additional financing through debt or the sale of additional equity securities will depend on our performance, as well as financial, business and other general economic factors affecting the credit and equity markets generally or our business in particular, many of which are beyond our control. Any such alternatives may not be available to us on satisfactory terms or at all.
Our note purchase agreements and revolving credit agreement contain, and our future indebtedness may contain, various covenants that may limit our business activities.
Our note purchase agreements and revolving credit agreement contain financial and operating covenants that limit our business activities, including restrictions on our ability to incur additional indebtedness and pay dividends to our stockholders. The agreements also restrict Holdings from making distributions to its partners (including us), other than tax distributions or
23
distributions to fund our ordinary expenses, if a default (as defined in the respective agreements) has occurred and is continuing or would result from such a distribution. In addition, if our average AUM for a fiscal quarter falls below $45 billion, Holdings will generally be required to offer to pre-pay the unsecured notes. Failure to comply with any of these restrictions could result in an event of default, giving our lenders the ability to accelerate repayment of our obligations. As of December 31, 2025, we believe we are in compliance with all of the covenants set forth in the agreements.
Risks Related to Our Structure
Control by our stockholders committee of approximately 9% of the combined voting power of our capital stock and the rights of holders of limited partnership units of Artisan Partners Holdings may give rise to conflicts of interest.
Certain shares of common stock held by current employees are subject to a stockholders agreement, pursuant to which a stockholders committee has been granted an irrevocable voting proxy with respect to such shares. Shares held by an employee cease to be subject to the stockholders agreement upon termination of employment or if the stockholders agreement is terminated. The stockholders committee currently consists of Jason A. Gottlieb (Chief Executive Officer and President), Eric R. Colson (Executive Chair) and Charles J. Daley, Jr. (Chief Financial Officer). All shares subject to the stockholders agreement are voted in accordance with the majority decision of those three members providing the committee with approximately 9% of the aggregate voting power as of February 14, 2026.
The consent of the holders of our Class A common units, voting as a single and separate class, is required for Holdings to engage in certain material corporate transactions, including a merger, consolidation, dissolution or sale of greater than 25% of the fair market value of Holdings’ assets. These voting and class approval rights may enable the holders of Class A common units to prevent the consummation of transactions that may be in the best interests of the holders of our Class A common stock.
In addition, because the majority of our pre-IPO owners, including certain members of APAM’s board of directors (the “Board”), hold or held a portion of their ownership interests in our business through Holdings, rather than through APAM, these pre-IPO owners may have conflicting interests with holders of our Class A common stock. For example, our pre-IPO owners may have different tax positions from us which could influence their decisions regarding whether and when we should dispose of assets, whether and when we should incur new or refinance existing indebtedness, especially in light of the existence of the tax receivable agreements, and whether and when Artisan Partners Asset Management should terminate the tax receivable agreements and accelerate its obligations thereunder. In addition, the structuring of future transactions may take into consideration these pre-IPO owners’ tax or other considerations even where no similar benefit would accrue to us.
Our ability to pay regular dividends to our stockholders is subject to the discretion of our Board and may be limited by our structure and applicable provisions of Delaware law.
We intend to pay dividends to holders of our Class A common stock as described in “Dividend Policy”. Our Board may, in its sole discretion, change the amount or frequency of dividends or discontinue the payment of dividends entirely. In addition, as a holding company, we are dependent upon the ability of our subsidiaries to generate earnings and cash flows and distribute them to us so that we may pay dividends to our stockholders. We expect to cause Holdings, a Delaware limited partnership, to make distributions to its partners, including us, in an amount sufficient for us to pay dividends. However, its ability to make such distributions will be subject to its and its subsidiaries’ operating results, cash requirements and financial condition, the applicable provisions of Delaware law, its compliance with covenants related to existing or future indebtedness, its other agreements with third parties, as well as its obligation to make tax distributions under its partnership agreement (which distributions would reduce the cash available for distributions by Holdings to us). As a result of these limitations and restrictions, we may not be able to pay, or may have to reduce, the dividends on our Class A common stock. Any change in the level of our dividends or the suspension of the payment thereof could adversely affect the market price of our Class A common stock.
Our ability to pay taxes and expenses, including payments under the tax receivable agreements (“TRAs”), may be limited by our holding company structure.
As a holding company, our assets principally consist of our ownership of partnership units of Holdings, deferred tax assets and cash and we have no independent means of generating revenue. Holdings is a partnership for U.S. federal income tax purposes and, as such, is not subject to U.S. federal income tax. Instead, Holdings’ taxable income is allocated to holders of its partnership units, including us. Accordingly, we incur income taxes on our proportionate share of Holdings’ taxable income and also incur expenses related to our operations. Under the terms of its amended and restated limited partnership agreement, Holdings is obligated to make tax distributions to holders of its partnership units, including us. In addition to tax expenses, we are also required to make payments under the TRAs, which will be significant, and we incur other expenses related to the TRAs and our operations. We intend to fund the payment of amounts due under the TRAs out of the reduced tax payments that APAM realizes in respect of the tax attributes to which the TRAs relate. We also intend to cause Holdings to make distributions in an amount sufficient to allow us to pay our taxes and additional operating expenses. However, its ability to make such distributions will be subject to various limitations and restrictions as set forth in the preceding risk factor. If, as a consequence of these various limitations and restrictions, we do not have sufficient funds to pay tax or other liabilities or to fund our operations, we may have to borrow funds and thus our liquidity and financial condition could be materially adversely affected. To the extent that we are unable to make payments when due under the TRAs, such payments will be deferred and will accrue interest from the due date (without extension) until such payments are made.
24
We will be required to pay the TRA beneficiaries for certain tax benefits we claim, and we expect that the payments we will be required to make will be substantial.
We are party to two TRAs. The first TRA generally provides for the payment by APAM to the assignees of the Pre-H&F Corp Merger Shareholder of 85% of the applicable cash savings, if any, of U.S. federal, state and local income taxes that APAM actually realizes (or is deemed to realize in certain circumstances) as a result of (i) the tax attributes of the preferred units APAM acquired in the merger of a wholly-owned subsidiary of the Pre-H&F Corp Merger Shareholder into APAM in March 2013 and (ii) tax benefits related to imputed interest.
The second TRA generally provides for the payment by APAM to current or former limited partners of Holdings or their assignees of 85% of the applicable cash savings, if any, of U.S. federal, state and local income taxes that APAM actually realizes (or is deemed to realize in certain circumstances) as a result of (i) certain tax attributes of their partnership units sold to us or exchanged (for shares of Class A common stock, convertible preferred stock or other consideration) and that are created as a result of such sales or exchanges and payments under the TRAs and (ii) tax benefits related to imputed interest.
The payment obligation under the TRAs is an obligation of APAM, not Holdings, and we expect that the payments we will be required to make under the TRAs will be substantial. Assuming no material changes in the relevant tax law and that APAM earns sufficient taxable income to realize all tax benefits that are subject to the TRAs, we expect that the reduction in tax payments for us associated with (i) the merger described above; (ii) the purchase or exchange of partnership units from March 2013 through December 31, 2025; and (iii) projected future purchases or exchanges of partnership units would aggregate to approximately $445 million over generally a minimum of 15 years, assuming the future purchases or exchanges described in clause (iii) occurred at a price of $40.74 per share of our Class A common stock, the closing price of our Class A common stock on December 31, 2025. Under such scenario we would be required to pay the other parties to the TRAs 85% of such amount, or approximately $420 million, over generally a minimum of 15 years. The actual amounts may materially differ from these hypothetical amounts, as potential future reductions in tax payments for us and TRA payments by us will be calculated using the market value of our Class A common stock at the time of purchase or exchange and the prevailing tax rates applicable to us over the life of the TRAs and will be dependent on us generating sufficient future taxable income to realize the benefit. As of December 31, 2025, we recorded a $303 million liability, representing amounts payable under the TRAs equal to 85% of the tax benefit we expected to realize from the H&F Corp merger described above, our purchase of partnership units from limited partners of Holdings and the exchange of partnership units from March 2013 through December 31, 2025, assuming no material changes in the related tax law and that APAM earns sufficient taxable income to realize all tax benefits subject to the TRAs.
The liability will increase upon future purchases or exchanges of limited partnership units with the increase representing amounts payable under the TRAs equal to 85% of the estimated future tax benefits, if any, resulting from such purchases or exchanges. Payments under the TRAs are not conditioned on the counterparties’ continued ownership of us. The actual increase in tax basis, as well as the amount and timing of any payments under these agreements, will vary depending upon a number of factors, including the timing of sales or exchanges by the holders of limited partnership units, the price of the Class A common stock at the time of such sales or exchanges, whether such sales or exchanges are taxable, the amount and timing of the taxable income APAM generates in the future and the tax rate then applicable and the portion of APAM’s payments under the TRAs constituting imputed interest or depreciable basis or amortizable basis. Payments under the TRAs are expected to give rise to certain additional tax benefits attributable to either further increases in basis or in the form of deductions for imputed interest, depending on the TRA and the circumstances. Any such benefits are covered by the TRAs and will increase the amounts due thereunder. In addition, the TRAs provide for interest to be accrued for the period starting with the due date (without extensions) of the corresponding APAM tax return until the actual date of the TRA payment, as specified in the TRAs. In addition, to the extent that we are unable to make payments when due under the TRAs, such payments will be deferred and will accrue interest at a rate specified under the TRAs.
Payments under the TRAs will be based on the tax reporting positions that we determine. Although we are not aware of any issue that would cause the IRS or other taxing authority to challenge a tax basis increase or other tax attributes subject to the TRAs, we will not be reimbursed for any payments previously made under the TRAs if such basis increases or other benefits are subsequently disallowed (however, any such additional payments may be netted against future payments (if any) that are made under the TRAs). As a result, in certain circumstances, payments could be made under the TRAs in excess of the benefits that we actually realize in respect of the attributes to which the TRAs relate.
In certain cases, payments under the TRAs may be accelerated and/or significantly exceed the actual benefits we realize in respect of the tax attributes subject to the TRAs.
The TRAs provide that (i) upon certain mergers, asset sales, other forms of business combinations or other changes of control, (ii) in the event that we materially breach any of our material obligations under the agreements or (iii) if, at any time, we elect an early termination of the agreements, our (or our successor’s) obligations under the agreements (with respect to all units, whether or not units have been exchanged or acquired before or after such transaction) would be based on certain assumptions. In the case of a material breach or if we elect early termination, those assumptions include that we would have sufficient taxable income to fully utilize the deductions arising from the increased tax deductions and tax basis and other benefits related to entering into the TRAs. In the case of a change of control, the assumptions include that in each taxable year ending on or after the closing date of the change of control, our taxable income (prior to the application of the tax deductions and tax basis and other benefits related to entering into the TRAs) will equal the greater of (i) the actual taxable income (prior to the application of the tax deductions and tax basis and other benefits related to entering into the TRAs) for the taxable year and (ii) the highest taxable income
25
(calculated without taking into account extraordinary items of income or deduction and prior to the application of the tax deductions and tax basis and other benefits related to entering into the TRAs) in any of the four fiscal quarters ended prior to the closing date of the change of control, annualized and increased by 10% for each taxable year beginning with the second taxable year following the closing date of the change of control. In the event we elect to terminate the agreements early or we materially breach a material obligation, our obligations under the agreements will accelerate. As a result, (i) we could be required to make payments under the TRAs that are greater than or less than the specified percentage of the actual benefits we realize in respect of the tax attributes subject to the agreements and (ii) if we materially breach a material obligation under the agreements or if we elect to terminate the agreements early, we would be required to make an immediate payment equal to the present value of the anticipated future tax benefits, which payment may be made significantly in advance of the actual realization of such future benefits. In these situations, our obligations under the TRAs could have a substantial negative impact on our liquidity and could have the effect of delaying, deferring or preventing certain mergers, asset sales, other forms of business combinations or other changes of control. There can be no assurance that we will be able to finance our obligations under the TRAs. If we were to elect to terminate the TRAs associated with (i) the merger described above; (ii) the purchase or exchange of partnership units from March 2013 through December 31, 2025; and (iii) projected future purchases or exchanges of partnership units, as of December 31, 2025, based on a share price of $40.74 per share of Class A common stock and certain other assumptions, we estimate that we would be required to pay approximately $322 million in the aggregate under the TRAs.
If we were deemed an investment company under the 1940 Act as a result of our ownership of Artisan Partners Holdings, applicable restrictions could make it impractical for us to continue our business as contemplated and could have a material adverse effect on our business.
We do not believe that we are an “investment company,” as such term is defined in Sections 3(a)(1)(A) and (C) of the 1940 Act. As its sole general partner, we control and operate Holdings. However, if we were to cease participation in the management of Holdings, our interest in Holdings could be deemed an “investment security” and we ultimately could be deemed an “investment company.”
We and Holdings intend to continue to conduct our operations so that we will not be deemed an investment company. However, if we were to be deemed an investment company, restrictions imposed by the 1940 Act, including limitations on our capital structure and our ability to transact with affiliates, could make it impractical for us to continue our business as contemplated and could have a material adverse effect on our business.
Risks Related to Our Class A Common Stock
Equity markets and the price of our Class A common stock have been, and may continue to be, volatile, which could result in rapid and substantial losses for our stockholders.
The market price of our Class A common stock is significantly impacted by fluctuations in the broader equity markets and, as a result, has experienced and may continue to experience volatility in price and volume. In addition, a relatively concentrated number of institutional stockholders own our Class A common stock. If our larger stockholders decide to reduce or liquidate their positions, the trading volume of our Class A common stock may fluctuate and cause significant price variations to occur. If the market price of our Class A common stock declines significantly, investors may be unable to sell shares of Class A common stock at or above their purchase price, if at all. The market price of our Class A common stock may fluctuate or decline significantly in the future.
Future sales of our Class A common stock in the public market could lower our stock price, and any future sale of equity or convertible securities may dilute existing stockholders’ ownership in us.
The market price of our Class A common stock could decline as a result of future sales of a large number of shares of our Class A common stock, or the perception that such sales could occur. These sales, or the possibility that such sales may occur, may make it more difficult for us to raise capital by selling equity securities in the future, at a time and price that we deem appropriate.
We are party to a resale and registration rights agreement pursuant to which the shares of our Class A common stock issued upon exchange of limited partnership units, on a one-for-one basis, are eligible for resale. Such shares of Class A common stock may be transferred in accordance with the terms and conditions of the resale and registration rights agreement, which our Board may waive or modify at any time. As a result of such modifications, there is generally no limit on the number of shares of our Class A common stock that our limited partners may sell upon exchange of their limited partnership units.
As of February 19, 2026, our Class A limited partners in the aggregate owned approximately 4.4 million Class A common units, Artisan Investment Corporation owned approximately 3.5 million Class D common units, our employee-partners in the aggregate owned 1.1 million Class B common units, and our former employee-partners owned 1.1 million Class E common units.
We may also purchase limited partnerships units of Holdings at any time and may issue and sell additional shares of our Class A common stock to fund such purchases. We cannot predict the size of future issuances of our Class A common stock or the effect, if any, that such future issuances and sales may have on the market price of our Class A common stock. Sales or distributions of substantial amounts of our Class A common stock (including shares issued in connection with an acquisition), or the perception that such sales could occur, may cause the market price of our Class A common stock to decline.
26
Including the grant approved by the Board in January 2026, as of February 19, 2026, there were 5,216,341 outstanding unvested restricted share-based awards and 297,007 outstanding restricted stock units granted pursuant to our compensation plans for employees and non-employee directors, respectively. Awards granted under these plans remain in effect until they have vested or been forfeited in accordance with the terms of the applicable plan and award agreement. Once shares issued pursuant to these plans have vested, they will be eligible for sale in the public market.
Provisions in our organizational documents, equity award agreements and Delaware law could discourage a change of control that stockholders may favor, which could negatively affect the market price of our Class A common stock.
Provisions in our restated certificate of incorporation, amended and restated bylaws and in the Delaware General Corporation Law, as well as the terms of our equity awards, may make it more difficult and expensive for a third party to acquire control of us even if a change of control would be beneficial to the interests of our stockholders. Those provisions include:
•The right of certain classes of our capital stock to vote, as separate classes, on certain amendments to our restated certificate of incorporation and certain fundamental transactions.
•The ability of our Board to determine to issue shares of preferred stock.
•Advance notice procedures that stockholders must comply with in order to nominate candidates to our Board or to propose matters to be acted upon at a stockholders’ meeting.
•A limitation that, generally, stockholder action may only be taken at an annual or special meeting or by unanimous written consent.
•A requirement that a special meeting of stockholders may be called only by our Board, the Chair of the Board or the Chief Executive Officer.
•The ability of our Board to adopt, amend and repeal our amended and restated bylaws by majority vote, while such action by stockholders would require a super majority vote.
•Except with respect to restricted share based awards held by our named executive officers which are double trigger, single trigger vesting upon a change in control. Prior to February 2019, our awards generally included double trigger vesting upon a change in control.
The market price of our Class A common stock could be adversely affected to the extent that the above factors discourage or delay potential takeover attempts that our stockholders may favor.
Our restated certificate of incorporation contains a forum selection clause, which could limit our stockholders’ ability to obtain a favorable judicial forum for disputes with us or our directors, officers, employees or agents.
Our restated certificate of incorporation provides that, unless we consent in writing to an alternative forum, the Court of Chancery of the State of Delaware will be the sole and exclusive forum for certain types of actions and proceedings that may be initiated by our stockholders. Any person acquiring any interest in any shares of our capital stock shall be deemed to have notice of and to have consented to this provision of our restated certificate of incorporation. This choice of forum provision may limit our stockholders’ ability to bring a claim in a judicial forum that it finds favorable for disputes with us or our directors, officers, employees or agents, which may discourage lawsuits against such parties. Alternatively, if a court were to find the forum selection clause inapplicable to, or unenforceable in respect of, one or more actions or proceedings, we may incur additional costs associated with resolving such matters in other jurisdictions, which could adversely affect our business and financial condition.
Our restated certificate of incorporation provides that certain of our investors do not have an obligation to offer us business opportunities.
Our restated certificate of incorporation provides that, to the fullest extent permitted by applicable law, certain of our investors and their respective affiliates (including affiliates who serve on our Board) have no obligation to offer us an opportunity to participate in the business opportunities presented to them, even if the opportunity is one that we might reasonably have pursued. Therefore, they may be free to compete with us in the same or a similar business. Furthermore, we renounce and waive and agree not to assert any claim for breach of any duty relating to any such opportunity against those investors and their affiliates by reason of any such activities unless, in the case of any person who is our director or officer, such opportunity is expressly offered to such person in writing solely in his or her capacity as an officer or director of us. This may create actual and potential conflicts of interest between us and certain of our investors and their affiliates (including certain of our directors).
27
Item 1B. Unresolved Staff Comments
None
Item 1C. Cybersecurity
Risk Management and Strategy
Information Security Program
We manage risk, including cybersecurity risk, via three distinct lines of defense. As the first line of defense, business managers, including IT managers, are responsible for maintaining effective internal controls and executing risk and control procedures on a day-to-day basis. As the second line of defense, the legal, compliance and information security governance functions provide guidance and training and perform monitoring, testing and surveillance activities relating to compliance with the firm’s policies and procedures, applicable laws and regulations, contractual requirements, ethical standards and industry best practices. As the third line of defense, our internal audit team provides periodic independent assurance that the firm’s internal controls are implemented and operating effectively.
With respect to cybersecurity risk, we have a dedicated security engineering and operations team, supplemented by security consultants and managed security service providers, that performs first line responsibilities, including identifying security risks, determining whether and how to implement security tools and controls, and implementing and maintaining those tools and controls. This team reports to our Chief Information Officer (CIO), who has over 30 years of information technology experience. We also have an information security governance team that is responsible for performing second line responsibilities, including training associates, providing advice to our associates in carrying out their responsibilities consistent with the goals of the security program, assessing whether the program is reasonably designed and operating effectively, and responding to and reporting to stakeholders on the reasonableness and effectiveness of the security program. The information security governance team is led by our Chief Information Security Officer (CISO), who is a Certified Information Systems Auditor (CISA), Certified Information Security Manager (CISM) and Certified Information Systems Security Professional (CISSP) and has almost 40 years of experience in the field of cybersecurity. Our CISO reports directly to our Chief Legal Officer and General Counsel. Together, these teams maintain a robust information security program that utilizes a multi-layered defense-in-depth strategy and is designed to prevent, detect, mitigate and remediate cybersecurity incidents.
Our information security program is subject to periodic internal audits and independent third-party reviews. We use third party security firms for security consulting, including configuration reviews and assessments, as well as performing periodic (no less frequently than annual) penetration tests to evaluate the integrity of our systems. We also conduct internal monitoring and testing activities, such as phishing simulations.
Oversight of Third-Party Service Providers
We engage many service providers in connection with our business operations. Some of these service providers play a minor role, while others perform services that are critical to our operations. We have a service provider oversight committee that oversees and facilitates the management of third-party relationships that are integral to our investment management activities. The committee maintains a written policy and other guidance that set forth our approach to managing and providing oversight of those third-party service providers in a manner consistent with the level of risk and complexity of the services provided. Our approach to oversight, which includes considerations regarding selection, initial and ongoing due diligence, contracting, ongoing monitoring and oversight and compliance with applicable regulatory and service level expectations, is tailored to each such service provider based on the scope of the services provided. Security assessments of those service providers may include questionnaires, meetings and onsite visits. We also consider contingency plans in the event a key service provider is not able to provide its respective services.
28
Governance
Role of Management
Management is responsible for the assessment and management of risk, including cybersecurity risk. The Artisan Risk and Integrity Committee facilitates the annual enterprise risk assessment that identifies and prioritizes the Company’s key risks, including cybersecurity risk. The information security governance team also reports to members of senior management the results of its annual cybersecurity risk assessment.
In the event a cybersecurity incident occurs, our incident response plan provides guidance in assessing and responding to the incident. The incident response plan establishes mechanisms by which we determine the scope of and potential damage caused by the incident and determine and execute the appropriate response. The plan outlines roles and responsibilities and sets forth escalation points to ensure that appropriate individuals and groups are notified and provided relevant information depending on the type and severity of the incident. Cybersecurity incidents are reported to each of the Company’s Chief Legal Officer, Chief Administrative Officer, Chief Operating Officer and the Chair of the Artisan Risk and Integrity Committee, who oversee the investigation and remain apprised of information regarding the remediation of the incident. This group, based on its assessment of the incident’s potential impact to the Company and its stakeholders, will also make determinations regarding further escalation of the incident to the full senior leadership team. The senior leadership team is kept informed of the investigation and is responsible for making certain decisions throughout the course of the investigation, including whether it is appropriate to report the incident to the Board prior to its next meeting.
Role of the Board of Directors
Our Board is responsible for overseeing management in the execution of its risk management responsibilities, including with respect to cybersecurity risk management. In addition, an overall review of risk is inherent in the Board’s ongoing oversight of our business, long-term strategies and other matters presented to our Board. Our Board exercises its risk oversight responsibilities periodically as part of actions taken and matters reviewed during its meetings and also through the activities of its standing committees. The Board has delegated responsibility for cybersecurity risk oversight to the Audit Committee.
The Audit Committee oversees cybersecurity risk management through the periodic reports it receives from management. On a quarterly basis, management reports on any significant cybersecurity events or trends impacting the Company. Annually, our CIO and CISO report to the Audit Committee on our information security program, including with respect to team updates, key areas of risk and the effectiveness of the program. The Audit Committee also reviews the Company’s cybersecurity insurance program on an annual basis in connection with the program’s renewal and receives periodic reports from our Director of Internal Audit regarding internal audits of our information security program.
Item 2. Properties
We lease all of our office space, including our largest office in Milwaukee, Wisconsin, where a majority of our employees are based. We believe our existing and contracted-for facilities are adequate to meet our requirements.
Item 3. Legal Proceedings
In the normal course of business, we may be subject to various legal and administrative proceedings. Currently, there are no legal or administrative proceedings that management believes may have a material adverse effect on our consolidated financial position, cash flows or results of operations.
Item 4. Mine Safety Disclosures
Not applicable
29
Information about our Executive Officers
Information regarding our executive officers is as follows:
Jason A. Gottlieb, age 56, has been chief executive officer and a director of Artisan Partners Asset Management since June 2025. He has also been president of Artisan Partners Asset Management since January 2021. From February 2017 to January 2021, he served as executive vice president of Artisan Partners Asset Management. Mr. Gottlieb joined Artisan Partners in October 2016 as a managing director and the chief operating officer of investments.
Eric R. Colson, age 56, is executive chair and a director of Artisan Partners Asset Management. Prior to becoming executive chair in June 2025, Mr. Colson served as chief executive officer of Artisan Partners Asset Management since March 2011. Mr. Colson also served as the president of Artisan Partners Asset Management from March 2011 to January 2021 and as chairman of the Company’s Board from August 2015 to August 2021. Mr. Colson served as the chief executive officer of Artisan Partners from January 2010 to June 2025. Prior to January 2010, Mr. Colson served as chief operating officer of investment operations from March 2007 through January 2010. Mr. Colson has been a managing director of Artisan Partners since he joined the firm in January 2005.
Charles J. Daley, Jr., age 63, has been executive vice president, chief financial officer and treasurer of Artisan Partners Asset Management since March 2011. He has served as the chief financial officer of Artisan Partners since August 2010 and has been a managing director since July 2010 when he joined the firm.
Christopher J. Krein, age 54, has been executive vice president of Artisan Partners Asset Management and Artisan Partners’ head of Global Distribution since January 2020. Prior to becoming head of Global Distribution, Mr. Krein was responsible for institutional marketing and client service for the Artisan Developing World team. Mr. Krein has been a managing director of Artisan Partners since he joined the firm in September 2015.
Eileen L. Kwei, age 47, has been executive vice president and chief administrative officer of Artisan Partners Asset Management since January 2021. From February 2018 to January 2021, Ms. Kwei was responsible for institutional marketing and client service for the Artisan Credit team. Prior to February 2018, Ms. Kwei was a relationship manager for the Artisan Global Equity team. Ms. Kwei joined Artisan Partners in June 2013 and has been a managing director of Artisan Partners since 2018.
Gregory K. Ramirez, age 55, has been executive vice president of Artisan Partners Asset Management since February 2016. From October 2013 to February 2016, he served as senior vice president and from April 2013 to October 2013 as assistant treasurer. Mr. Ramirez is currently head of Vehicle and Investor Operations for Artisan Partners and serves as chair of the Artisan Risk and Integrity Committee. Mr. Ramirez was named a managing director of Artisan Partners in April 2003.
Samuel B. Sellers, age 43, has been executive vice president and chief operating officer of Artisan Partners Asset Management since January 2023. Prior to his current role, Mr. Sellers was head of Investment Operations from January 2021. Previously, he served as deputy general counsel from January 2015 and associate counsel from April 2013.
Laura E. Simpson, age 50, has been executive vice president, chief legal officer and secretary of Artisan Partners Asset Management since October 2023. From January 2023 to October 2023 she served as assistant secretary of Artisan Partners Asset Management. She has served as general counsel of Artisan Partners since October 2022. Prior to then she served as deputy general counsel from January 2015 and associate counsel from April 2011.
30
PART II
Item 5. Market for Registrant’s Common Equity, Related Stockholder Matters and Issuer Purchases of Equity Securities.
Shares of our Class A common stock have been listed and traded on the NYSE under the symbol “APAM” since March 7, 2013. As of February 19, 2026, there were approximately 103 stockholders of record of our Class A common stock, 16 stockholders of record of our Class B common stock, and 27 stockholders of record of our Class C common stock. These figures do not reflect beneficial ownership or shares held in nominee name, nor do they include holders of any restricted stock units or performance share units. There is no trading market for shares of our Class B common stock or Class C common stock.
Performance Graph
The following graph compares the year-end cumulative total stockholder return of our Class A common stock during the five-year period ended December 31, 2025, with the year-end cumulative total return of the S&P 500® and the Dow Jones U.S. Asset Managers Index. The graph assumes the investment of $100 in our common stock and in the market indices and the reinvestment of all dividends.
| For the Years Ended December 31, | |||||||||||||||||
| 2021 | 2022 | 2023 | 2024 | 2025 | |||||||||||||
| Artisan Partners Asset Management Inc. | $ | 102.70 | $ | 70.56 | $ | 113.03 | $ | 118.46 | $ | 121.69 | |||||||
| S&P 500 Index | $ | 128.71 | $ | 105.40 | $ | 133.10 | $ | 166.40 | $ | 196.16 | |||||||
| Dow Jones U.S. Asset Managers Index | $ | 140.62 | $ | 110.22 | $ | 135.39 | $ | 186.85 | $ | 196.10 | |||||||
The above table is provided pursuant to SEC regulations and the outcomes are impacted significantly by beginning- and end-point stock price, as well as the price at which dividends are reinvested. A stockholder who invested in APAM at its IPO on March 7, 2013, at the IPO price of $30 per share would have experienced an 8% annual total return as of December 31, 2025, if all dividends were retained, compared to an 11% annual total return if all dividends were reinvested.
Dividend Policy
During the first quarter of 2026, our Board declared a dividend of $1.58 per share of Class A common stock, consisting of a variable quarterly dividend of $1.01 per share with respect to the fourth quarter of 2025 and a special annual dividend of $0.57 per share. The variable quarterly dividend of $1.01 per share represents approximately 80% of the cash generated in the fourth quarter of 2025. Subject to Board approval each quarter, we currently expect to pay a quarterly dividend of approximately 80% of the cash the Company generates each quarter from operations. We expect quarterly cash generation to approximate adjusted net income plus long-term incentive compensation award expense, less cash reserved for future franchise capital awards, with additional adjustments made for certain other sources and uses of cash, including capital expenditures. After the end of the year, our Board will consider payment of a special dividend from the 20% withheld each quarter plus any discrete sources and uses of cash throughout the year, including gains realized upon seed capital redemptions and investments redeemed in connection with forfeited franchise capital awards.
31
We intend to fund dividends from our portion of distributions made by Holdings from its available cash generated from operations. The holders of our Class B common stock and Class C common stock are not entitled to any cash dividends in their capacity as stockholders but, in their capacity as holders of limited partnership units of Holdings, they generally participate on a pro rata basis in distributions by Holdings.
The declaration and payment of all future dividends, if any, will be at the sole discretion of our Board. In determining the amount of any future dividends, our Board will take into account: (i) our financial results, (ii) our available cash, as well as anticipated cash requirements (including debt servicing, seed capital for new investment strategies and vehicles, and cash required to support growth and strategic initiatives, including through acquisition), (iii) our capital requirements and the capital requirements of our subsidiaries (including Holdings), (iv) contractual, legal, tax and regulatory restrictions on, and implications of, the payment of dividends by us to our stockholders or by our subsidiaries (including Holdings) to us, including the obligation of Holdings to make tax distributions to the holders of partnership units (including us), (v) general economic and business conditions and (vi) any other factors that our Board may deem relevant.
As a holding company, our assets principally consist of our ownership of partnership units of Holdings, deferred tax assets and cash. Accordingly, we depend on distributions from Holdings to fund any dividends we may pay. We intend to cause Holdings to distribute cash to its partners, including us, in an amount sufficient to cover dividends, if any, declared by us. If we do cause Holdings to make such distributions, holders of Holdings limited partnership units will be entitled to receive equivalent distributions on a pro rata basis.
Our dividend policy has certain risks and limitations, particularly with respect to liquidity. Although we expect to pay dividends according to our dividend policy, we may not pay dividends according to our policy, or at all, if, among other things, Holdings is unable to make distributions to us as a result of its operating results, cash requirements and financial condition, the applicable laws of the State of Delaware (which may limit the amount of funds available for distribution), its compliance with covenants and financial ratios related to indebtedness (including the notes and the revolving credit agreement) and its other agreements with third parties. Our note purchase and revolving credit agreements contain covenants limiting Holdings’ ability to make distributions if a default has occurred and is continuing or would result from such a distribution. See “Management’s Discussion and Analysis of Financial Condition and Results of Operations—Liquidity, Capital Resources, and Contractual Obligations”.
Under the Delaware General Corporation Law, we may only pay dividends from legally available surplus or, if there is no such surplus, out of our net profits for the fiscal year in which the dividend is declared and/or the preceding fiscal year. Surplus is defined as the excess of the fair value of our total assets over the sum of the fair value of our total liabilities plus the par value of our outstanding capital stock. Capital stock is defined as the aggregate of the par value of all issued capital stock. To the extent we do not have sufficient cash to pay dividends, we may decide not to pay dividends.
Unregistered Sales of Equity Securities
As described in Note 8, “Stockholders’ Equity”, to the consolidated financial statements included in Item 8 of this report, upon termination of employment with Artisan, an employee-partner’s Class B common units are exchanged for Class E common units and the corresponding shares of Class B common stock are canceled. APAM issues the former employee-partner a number of shares of Class C common stock equal to the former employee-partner’s number of Class E common units. Class E common units are exchangeable for Class A common stock subject to the same restrictions and limitations on exchange applicable to the other common units of Holdings. During the three months ended December 31, 2025, 83,134 shares of Class B common stock were canceled, and 83,134 shares of Class C common stock were issued, as a result of the termination of employment of an employee-partner.
32
Item 6. [Reserved]
Item 7. Management’s Discussion and Analysis of Financial Condition and Results of Operations
The following discussion and analysis of the results of operations and financial condition of the Company should be read in conjunction with the “Forward-Looking Statements” disclosure preceding Part I and the “Risk Factors” set forth in Item 1A of Part I of this Annual Report on Form 10‑K, each of which describe our risks, uncertainties and other important factors in more detail.
Overview and Recent Highlights
We are a global multi-asset investment platform focused on providing a broad range of high-value added investment strategies in growing asset classes to sophisticated clients around the world. As of December 31, 2025, our 11 autonomous investment teams managed a total of 26 investment strategies across multiple asset classes and investment styles.
We focus on attracting, retaining and developing talented investment professionals and creating an environment in which each investment team is provided ample resources and support, transparent and direct financial incentives, a high degree of investment autonomy, and a long-term time horizon. We create new investment strategies when we identify opportunities to add value for clients, oftentimes through the use of a broad array of securities, instruments, and techniques (which we call degrees of freedom) to differentiate returns and manage risk.
We offer our investment management capabilities primarily to sophisticated investors that operate with institutional decision-making processes and longer-term investment horizons. We employ knowledgeable and investment focused relationship managers who are directly aligned with our investment teams, and we pair them with regional and distribution channel experts. We provide access to our investment strategies through multiple investment vehicles, including separate accounts and different types of pooled vehicles. As of December 31, 2025, approximately 74% of our AUM were managed for clients and investors domiciled in the U.S. and 26% of our AUM were managed for clients and investors domiciled outside of the U.S.
As a high value-added investment manager we expect that long-term investment performance will be the primary driver of our long-term business and financial results. If we maintain and evolve existing investment strategies and launch new investment strategies that meet the needs of and generate attractive outcomes for sophisticated asset allocators, we believe that we will continue to generate strong business and financial results.
Over shorter time periods, changes in our business and financial results are largely driven by market conditions and fluctuations in our AUM that may not necessarily be the result of our long-term investment performance or the long-term demand for our strategies. For this reason, we expect that our business and financial results will be lumpy over time.
We strive to maintain a financial model that is transparent and predictable. We derive nearly all of our revenues from investment management fees, most of which are based on a specified percentage of clients’ average AUM. A majority of our expenses, including most of our compensation expense, vary directly with changes in our revenues.
We invest thoughtfully to support our investment teams and future growth, while also paying out to stockholders and partners a majority of the cash that we generate from operations through dividends and distributions. We expect to continue to invest in the growth of the business, with a focus on adding new investment capabilities and more degrees of freedom in areas where both opportunity and client demand exist, and in which we can differentiate our active management and add value for clients.
Financial highlights for 2025 included the following:
•During the year ended December 31, 2025, our AUM increased to $179.9 billion, an increase of $18.7 billion, or 12%, compared to $161.2 billion at December 31, 2024, as a result of $33.4 billion of market appreciation, partially offset by $12.7 billion of net client cash outflows, and $2.0 billion of Artisan Funds’ distributions that were not reinvested by fund shareholders.
•Average AUM for the year ended December 31, 2025 was $173.0 billion, an increase of 8.0% from the average of $160.2 billion for the year ended December 31, 2024.
•We earned $1,196.7 million in revenue for the year ended December 31, 2025, a 7.6% increase from revenues of $1,111.8 million for the year ended December 31, 2024.
•Our GAAP operating margin was 33.4% in 2025, compared to 33.0% in 2024. Adjusted operating margin was 35.3% in 2025, compared to 33.8% in 2024.
•We generated $4.05 of earnings per basic and diluted share and $3.93 of adjusted EPS.
•We declared and distributed dividends of $3.63 per share of Class A common stock during 2025.
•We declared, effective February 3, 2026, a quarterly dividend of $1.01 per share of Class A common stock with respect to the December 2025 quarter and a special annual dividend of $0.57 per share, for a total of $3.87 of dividends per share with respect to 2025.
33
Organizational Structure
Organizational Structure
Our operations are conducted through Artisan Partners Holdings LP (“Holdings”) and its subsidiaries. On March 12, 2013, Artisan Partners Asset Management Inc. (“APAM”) and Holdings completed a series of transactions (the “IPO Reorganization”) to reorganize their capital structures in connection with the initial public offering (“IPO”) of APAM’s Class A common stock. The IPO Reorganization and IPO were completed on March 12, 2013.
Limited partners of Holdings, some of whom are employees, held approximately 13% of the equity interests in Holdings as of December 31, 2025. Our results reflect that significant noncontrolling interest.
We operate our business in a single segment.
Holdings Unit Exchanges
During the year ended December 31, 2025, certain limited partners of Holdings exchanged 71,500 common units (along with a corresponding number of shares of Class B or Class C common stock of APAM, as applicable) for 71,500 shares of Class A common stock. In connection with the exchanges, APAM received 71,500 GP units of Holdings.
APAM’s equity ownership interest in Holdings was 87% at December 31, 2024 and December 31, 2025.
Financial Overview
Economic Environment
Global market conditions can materially impact our financial performance. Because the revenue we earn is based on the value of our AUM, fluctuations in our AUM due to changes in the economic environment and financial markets will result in corresponding fluctuations in our revenues and earnings.
The following table presents the total returns of relevant market indices for the years ended December 31, 2025, 2024 and 2023:
| For the Years Ended December 31, | |||||||||||||||||
| 2025 | 2024 | 2023 | |||||||||||||||
| S&P 500 Index | 17.9 | % | 25.0 | % | 26.3 | % | |||||||||||
| MSCI All Country World Index | 22.3 | % | 17.5 | % | 22.2 | % | |||||||||||
| MSCI EAFE Index | 31.2 | % | 3.8 | % | 18.2 | % | |||||||||||
Russell® Midcap Index | 10.6 | % | 15.3 | % | 17.2 | % | |||||||||||
| MSCI Emerging Markets Index | 33.6 | % | 7.5 | % | 9.8 | % | |||||||||||
| ICE BofA US High Yield Index | 8.5 | % | 8.2 | % | 13.5 | % | |||||||||||
34
Key Performance Indicators
When we review our business and financial performance we consider, among other things, the following:
| For the Years Ended December 31, | |||||||||||||||||
| 2025 | 2024 | 2023 | |||||||||||||||
| (unaudited; dollars in millions) | |||||||||||||||||
| Assets under management at period end | $ | 179,928 | $ | 161,208 | $ | 150,167 | |||||||||||
Average assets under management (1) | $ | 173,004 | $ | 160,232 | $ | 139,321 | |||||||||||
Net client cash flows (2) | $ | (12,662) | $ | (3,699) | $ | (4,076) | |||||||||||
| Total revenues | $ | 1,197 | $ | 1,112 | $ | 975 | |||||||||||
Weighted average fee (3) | 69.3 bps | 69.5 bps | 70.4 bps | ||||||||||||||
| Operating margin | 33.4 | % | 33.0 | % | 31.1 | % | |||||||||||
Adjusted operating margin (4) | 35.3 | % | 33.8 | % | 31.6 | % | |||||||||||
(1) We compute average AUM by averaging day-end AUM for the applicable period. | |||||||||||||||||
(2) Net client cash flows excludes Artisan Funds’ income and capital gain distributions that were not reinvested by fund shareholders. | |||||||||||||||||
(3) We compute our weighted average fee by dividing annualized investment management fees, including performance fees, by average AUM for the applicable period. Prior to December 2025, we presented weighted average management fee, which excluded performance fees. The change was made as performance fees have become a more meaningful component of our revenues. Historical figures have been recast for comparability. AUM within our consolidated investment products, and any investment advisory fees earned thereon, are excluded from our weighted average fee calculations since any such revenues are eliminated upon consolidation. | |||||||||||||||||
(4) Adjusted measures are non-GAAP measures and are explained and reconciled to the comparable GAAP measures in “Supplemental Non-GAAP Financial Information” below. | |||||||||||||||||
Assets Under Management and Investment Performance
Changes to our operating results from one period to another are primarily caused by changes in the amount of our AUM. A key driver of changes in our AUM over time is the long-term investment performance of our investment strategies. Changes in the relative composition of our AUM among our investment strategies and vehicles and the effective fee rates on our investment products also impact our operating results.
The amount and composition of our AUM are, and will continue to be, influenced by a variety of factors including, among others:
•investment performance, including fluctuations in financial markets and foreign currency exchange rates and the quality of our investment decisions, as assessed relative to applicable third-party benchmarks and peer groups, as appropriate;
•flows of client assets into and out of our various strategies and investment vehicles;
•our decision to close strategies or limit the growth of assets in a strategy or a vehicle when we believe it is in the best interest of our clients, as well as our decision to re-open strategies, in part or entirely;
•our ability to attract and retain qualified investment, management, and marketing and client service professionals;
•industry trends towards products, strategies, vehicles or services that we do not offer;
•competitive conditions in the investment management and broader financial services sectors; and
•investor sentiment and confidence.
35
The table below sets forth changes in our total AUM:
| For the Years Ended December 31, | |||||||||||||||||
| 2025 | 2024 | 2023 | |||||||||||||||
| (unaudited; dollars in millions) | |||||||||||||||||
| Beginning assets under management | $ | 161,208 | $ | 150,167 | $ | 127,892 | |||||||||||
| Gross client cash inflows | 27,034 | 25,650 | 21,395 | ||||||||||||||
| Gross client cash outflows | (39,696) | (29,349) | (25,471) | ||||||||||||||
Net client cash flows (1) | (12,662) | (3,699) | (4,076) | ||||||||||||||
| Artisan Funds’ distributions not reinvested | (1,982) | (1,193) | (684) | ||||||||||||||
Investment returns and other (2) | 33,364 | 15,933 | 27,035 | ||||||||||||||
| Ending assets under management | $ | 179,928 | $ | 161,208 | $ | 150,167 | |||||||||||
| Average assets under management | $ | 173,004 | $ | 160,232 | $ | 139,321 | |||||||||||
(1) Net client cash flows excludes Artisan Funds’ income and capital gain distributions that were not reinvested by fund shareholders. | |||||||||||||||||
(2) Includes the impact of translating the value of AUM denominated in non-USD currencies into U.S. dollars. The impact was immaterial for the periods presented. | |||||||||||||||||
Our equity strategies experienced net outflows of $15.6 billion in 2025, driven primarily by the Global Opportunities, U.S. Mid-Cap Growth and Non-U.S. Small-Mid Growth strategies. These outflows reflected (i) weaker relative performance over recent periods in certain strategies, (ii) client reallocations across asset classes and vehicles and (iii) profit taking following strong longer-term absolute returns in certain strategies. In contrast, our Credit and Alternative asset classes each generated net inflows in 2025, supported by relative performance and continued client demand for those asset classes.
While net flows are inherently difficult to predict, if recent performance and market trends persist, we could continue to experience net outflows in our equity strategies and net inflows in our credit and alternative strategies in 2026. Over the long term, we expect to generate the majority of our AUM growth through investment returns, which has been our historical experience.
We monitor the availability of attractive investment opportunities relative to the amount of assets we manage in each of our investment strategies and the velocity at which the strategies are experiencing inflows. When appropriate, we will close a strategy to new investors or otherwise take action to slow or restrict its growth, even though our aggregate AUM may be negatively impacted in the short term. We may also re-open a strategy, widely or selectively, to fill available capacity or manage the diversification of our client base in that strategy. We believe that management of our investment capacity protects our ability to manage assets successfully, which protects the interests of our clients and, in the long term, protects our ability to retain client assets and maintain our profit margins.
When we close or otherwise restrict the growth of a strategy, we typically continue to allow additional investments in the strategy by existing clients and certain related entities. We may also permit new investments by other eligible investors in our discretion. As a result, during a given period we may have net client cash inflows in a closed strategy. However, when a strategy is closed or its growth is restricted we expect there to be periods of net client cash outflows.
The unaudited table on the following page sets forth the average annual total returns (gross of fees) for each composite and its respective benchmark (and style benchmark, if applicable) over a multi-horizon time period as of December 31, 2025. Returns for periods less than one year are not annualized.
36
| Composite Inception | Strategy AUM | Average Annual Total Returns (Gross of Fees)(2) | Average Annual Value-Added (3) Since Inception (bps) | ||||||||||||||||||||||||||||||||
| Investment Team and Strategy | Date | (in $MM) (1) | 1 YR | 3 YR | 5 YR | 10 YR | Inception | ||||||||||||||||||||||||||||
| Growth Team | |||||||||||||||||||||||||||||||||||
| Global Opportunities Strategy | 2/1/2007 | $ | 16,537 | 10.14% | 16.73% | 5.25% | 12.42% | 11.00% | 348 | ||||||||||||||||||||||||||
| MSCI All Country World Index | 22.34% | 20.63% | 11.19% | 11.71% | 7.52% | ||||||||||||||||||||||||||||||
| Global Discovery Strategy | 9/1/2017 | 1,107 | 13.25% | 17.59% | 5.33% | --- | 13.51% | 530 | |||||||||||||||||||||||||||
| MSCI All Country World Small Mid Cap Index | 19.29% | 14.56% | 7.27% | --- | 8.21% | ||||||||||||||||||||||||||||||
| U.S. Mid-Cap Growth Strategy | 4/1/1997 | 10,280 | 16.05% | 18.13% | 3.33% | 12.08% | 14.33% | 440 | |||||||||||||||||||||||||||
Russell® Midcap Index | 10.60% | 14.34% | 8.67% | 11.00% | 10.32% | ||||||||||||||||||||||||||||||
Russell® Midcap Growth Index | 8.66% | 18.62% | 6.64% | 12.48% | 9.93% | ||||||||||||||||||||||||||||||
| U.S. Small-Cap Growth Strategy | 4/1/1995 | 2,782 | 9.56% | 12.26% | (1.42)% | 11.82% | 10.55% | 260 | |||||||||||||||||||||||||||
Russell® 2000 Index | 12.81% | 13.72% | 6.09% | 9.61% | 9.05% | ||||||||||||||||||||||||||||||
Russell® 2000 Growth Index | 13.01% | 15.57% | 3.18% | 9.57% | 7.95% | ||||||||||||||||||||||||||||||
| Franchise Strategy | 10/1/2024 | $ | 553 | 21.10% | --- | --- | --- | 16.89% | 35 | ||||||||||||||||||||||||||
| MSCI All Country World Index | 22.34% | --- | --- | --- | 16.54% | ||||||||||||||||||||||||||||||
| Global Equity Team | |||||||||||||||||||||||||||||||||||
| Global Equity Strategy | 4/1/2010 | 432 | 47.84% | 25.85% | 11.25% | 14.37% | 13.66% | 373 | |||||||||||||||||||||||||||
| MSCI All Country World Index | 22.34% | 20.63% | 11.19% | 11.71% | 9.93% | ||||||||||||||||||||||||||||||
| Non-U.S. Growth Strategy | 1/1/1996 | 15,475 | 37.93% | 21.19% | 9.83% | 9.47% | 10.22% | 456 | |||||||||||||||||||||||||||
| MSCI EAFE Index | 31.22% | 17.21% | 8.92% | 8.18% | 5.66% | ||||||||||||||||||||||||||||||
| U.S. Value Team | |||||||||||||||||||||||||||||||||||
| Value Equity Strategy | 7/1/2005 | 5,750 | 14.66% | 17.76% | 13.28% | 13.57% | 9.86% | 149 | |||||||||||||||||||||||||||
Russell® 1000 Index | 17.37% | 22.72% | 13.58% | 14.58% | 10.97% | ||||||||||||||||||||||||||||||
Russell® 1000 Value Index | 15.91% | 13.88% | 11.32% | 10.52% | 8.37% | ||||||||||||||||||||||||||||||
| U.S. Mid-Cap Value Strategy | 4/1/1999 | 2,113 | 2.82% | 9.07% | 7.82% | 9.11% | 11.48% | 191 | |||||||||||||||||||||||||||
Russell® Midcap Index | 10.60% | 14.34% | 8.67% | 11.00% | 9.67% | ||||||||||||||||||||||||||||||
Russell® Midcap Value Index | 11.05% | 12.26% | 9.82% | 9.77% | 9.57% | ||||||||||||||||||||||||||||||
| Value Income Strategy | 3/1/2022 | 17 | 11.35% | 11.48% | --- | --- | 6.61% | (744) | |||||||||||||||||||||||||||
| S&P 500 Index | 17.88% | 22.98% | --- | --- | 14.05% | ||||||||||||||||||||||||||||||
| International Value Group | |||||||||||||||||||||||||||||||||||
| International Value Strategy | 7/1/2002 | 53,064 | 24.05% | 18.39% | 12.97% | 11.18% | 12.03% | 515 | |||||||||||||||||||||||||||
| MSCI EAFE Index | 31.22% | 17.21% | 8.92% | 8.18% | 6.88% | ||||||||||||||||||||||||||||||
| International Explorer Strategy | 11/1/2020 | 912 | 20.17% | 16.43% | 10.57% | --- | 14.83% | 401 | |||||||||||||||||||||||||||
| MSCI All Country World Index Ex USA Small Cap | 29.26% | 15.59% | 6.90% | --- | 10.82% | ||||||||||||||||||||||||||||||
| Global Special Situations Strategy | 4/1/2025 | 34 | --- | --- | --- | --- | 7.22% | (140) | |||||||||||||||||||||||||||
| ICE BofA Global High Yield Index | --- | --- | --- | --- | 8.62% | ||||||||||||||||||||||||||||||
| Global Value Team | |||||||||||||||||||||||||||||||||||
| Global Value Strategy | 7/1/2007 | 36,280 | 35.45% | 24.71% | 14.65% | 12.46% | 10.22% | 301 | |||||||||||||||||||||||||||
| MSCI All Country World Index | 22.34% | 20.63% | 11.19% | 11.71% | 7.21% | ||||||||||||||||||||||||||||||
| Select Equity Strategy | 3/1/2020 | 984 | 30.58% | 24.95% | 13.91% | --- | 15.77% | (147) | |||||||||||||||||||||||||||
| S&P 500 Index | 17.88% | 22.98% | 14.42% | --- | 17.24% | ||||||||||||||||||||||||||||||
| Sustainable Emerging Markets Team | |||||||||||||||||||||||||||||||||||
| Sustainable Emerging Markets Strategy | 7/1/2006 | 2,537 | 43.91% | 22.58% | 5.99% | 11.02% | 6.95% | 118 | |||||||||||||||||||||||||||
| MSCI Emerging Markets Index | 33.57% | 16.38% | 4.19% | 8.41% | 5.77% | ||||||||||||||||||||||||||||||
| Credit Team | |||||||||||||||||||||||||||||||||||
| High Income Strategy | 4/1/2014 | 13,191 | 9.08% | 11.74% | 6.32% | 8.16% | 7.31% | 232 | |||||||||||||||||||||||||||
| ICE BofA US High Yield Index | 8.50% | 10.02% | 4.49% | 6.44% | 4.99% | ||||||||||||||||||||||||||||||
| Credit Opportunities Strategy | 7/1/2017 | 367 | 11.06% | 18.58% | 13.73% | --- | 13.57% | 1,091 | |||||||||||||||||||||||||||
| ICE BofA US Dollar 3-Month Deposit Offered Rate Constant Maturity Index | 4.42% | 5.00% | 3.25% | --- | 2.66% | ||||||||||||||||||||||||||||||
| Floating Rate Strategy | 1/1/2022 | 93 | 7.50% | 10.35% | --- | --- | 7.45% | 84 | |||||||||||||||||||||||||||
| S&P UBS Leveraged Loan Index | 5.94% | 9.30% | --- | --- | 6.61% | ||||||||||||||||||||||||||||||
Custom Credit Solutions (4) | 7/1/2025 | 1,400 | --- | --- | --- | --- | --- | --- | |||||||||||||||||||||||||||
37
| Developing World Team | |||||||||||||||||||||||||||||||||||
| Developing World Strategy | 7/1/2015 | 4,283 | 9.15% | 22.93% | 0.17% | 13.37% | 11.36% | 531 | |||||||||||||||||||||||||||
| MSCI Emerging Markets Index | 33.57% | 16.38% | 4.19% | 8.41% | 6.05% | ||||||||||||||||||||||||||||||
| Antero Peak Group | |||||||||||||||||||||||||||||||||||
| Antero Peak Strategy | 5/1/2017 | 2,220 | 21.80% | 23.66% | 12.20% | --- | 18.98% | 415 | |||||||||||||||||||||||||||
| S&P 500 Index | 17.88% | 22.98% | 14.42% | --- | 14.83% | ||||||||||||||||||||||||||||||
| Antero Peak Hedge Strategy | 11/1/2017 | 226 | 18.28% | 20.32% | 9.92% | --- | 13.86% | (73) | |||||||||||||||||||||||||||
| S&P 500 Index | 17.88% | 22.98% | 14.42% | --- | 14.59% | ||||||||||||||||||||||||||||||
| International Small-Mid Team | |||||||||||||||||||||||||||||||||||
| Non-U.S. Small-Mid Growth Strategy | 1/1/2019 | 4,913 | 19.78% | 10.73% | 1.92% | --- | 10.86% | 123 | |||||||||||||||||||||||||||
| MSCI All Country World Index Ex USA Small Mid Cap | 30.74% | 16.13% | 6.80% | --- | 9.63% | ||||||||||||||||||||||||||||||
| EMsights Capital Group | |||||||||||||||||||||||||||||||||||
| Global Unconstrained Strategy | 4/1/2022 | 1,185 | 12.79% | 11.30% | --- | --- | 11.30% | 708 | |||||||||||||||||||||||||||
| ICE BofA 3-month Treasury Bill Index | 4.18% | 4.81% | --- | --- | 4.22% | ||||||||||||||||||||||||||||||
| Emerging Markets Debt Opportunities Strategy | 5/1/2022 | 1,332 | 16.77% | 14.01% | --- | --- | 13.74% | 630 | |||||||||||||||||||||||||||
| J.P. Morgan EMB Hard Currency/Local Currency 50-50 | 15.34% | 9.54% | --- | --- | 7.44% | ||||||||||||||||||||||||||||||
| Emerging Markets Local Opportunities Strategy | 8/1/2022 | 1,861 | 25.39% | 13.73% | --- | --- | 13.16% | 395 | |||||||||||||||||||||||||||
| J.P. Morgan GBI-EM Global Diversified Index | 19.26% | 9.47% | --- | --- | 9.21% | ||||||||||||||||||||||||||||||
| Total Assets Under Management | $ | 179,928 | |||||||||||||||||||||||||||||||||
(1) AUM includes $123 million in the aggregate for which Artisan Partners provides investment models to managed account sponsors (reported on a lag not exceeding one quarter). | |||||||||||||||||||||||||||||||||||
(2) We measure investment performance based upon the results of our “composites”, which represent the aggregate performance of all discretionary client accounts, including pooled investment vehicles, invested in the same strategy except those accounts with respect to which we believe client-imposed restrictions may have a material impact on portfolio construction and those accounts managed in a currency other than U.S. dollars (the results of these accounts, which represented approximately 18% of our AUM at December 31, 2025, are maintained in separate composites, which are not presented in these materials). Returns for periods less than one year are not annualized. | |||||||||||||||||||||||||||||||||||
(3) Value-added is the amount, in basis points, by which the average annual gross composite return of each of our strategies has outperformed or underperformed its respective benchmark. See Forward-Looking Statements and Other Disclosures for further information on the benchmark indexes used. Value-added for periods less than one year is not annualized. | |||||||||||||||||||||||||||||||||||
(4) Custom Credit Solutions represents assets managed by the Credit team within custom, investor-driven mandates for which there is no combined performance track record. A portion of this AUM was previously reported under the High Income strategy through month end June 30, 2025. | |||||||||||||||||||||||||||||||||||
38
The tables below set forth changes in our AUM by investment team:
By Investment Team (1) | ||||||||||||||||||||||||||||||||||||||
| Year Ended | Growth | Global Equity | U.S. Value | Int’l Value Group | Global Value | SEM | Credit | Developing World | Antero Peak Group | Int’l Small-Mid | EMsights Capital Group | Total | ||||||||||||||||||||||||||
| December 31, 2025 | (unaudited; in millions) | |||||||||||||||||||||||||||||||||||||
| Beginning assets under management | $ | 38,445 | $ | 12,934 | $ | 7,597 | $ | 44,295 | $ | 28,679 | $ | 1,552 | $ | 11,942 | $ | 4,100 | $ | 2,211 | $ | 6,544 | $ | 2,909 | $ | 161,208 | ||||||||||||||
| Gross client cash inflows | 3,673 | 1,380 | 744 | 8,728 | 3,780 | 630 | 4,814 | 828 | 491 | 642 | 1,324 | 27,034 | ||||||||||||||||||||||||||
| Gross client cash outflows | (14,698) | (2,668) | (1,200) | (8,232) | (4,904) | (332) | (2,376) | (972) | (668) | (3,174) | (472) | (39,696) | ||||||||||||||||||||||||||
Net client cash flows (2) | (11,025) | (1,288) | (456) | 496 | (1,124) | 298 | 2,438 | (144) | (177) | (2,532) | 852 | (12,662) | ||||||||||||||||||||||||||
| Artisan Funds’ distributions not reinvested | (83) | (271) | (16) | (1,110) | (39) | (2) | (377) | — | (23) | (52) | (9) | (1,982) | ||||||||||||||||||||||||||
| Investment returns and other | 3,922 | 4,532 | 755 | 10,329 | 9,748 | 689 | 1,048 | 327 | 435 | 953 | 626 | 33,364 | ||||||||||||||||||||||||||
| Ending assets under management | $ | 31,259 | $ | 15,907 | $ | 7,880 | $ | 54,010 | $ | 37,264 | $ | 2,537 | $ | 15,051 | $ | 4,283 | $ | 2,446 | $ | 4,913 | $ | 4,378 | $ | 179,928 | ||||||||||||||
| Average assets under management | $ | 36,189 | $ | 14,774 | $ | 7,635 | $ | 50,186 | $ | 32,802 | $ | 2,001 | $ | 13,239 | $ | 4,571 | $ | 2,388 | $ | 5,532 | $ | 3,687 | $ | 173,004 | ||||||||||||||
| December 31, 2024 | ||||||||||||||||||||||||||||||||||||||
| Beginning assets under management | $ | 38,546 | $ | 13,725 | $ | 7,057 | $ | 41,009 | $ | 25,670 | $ | 917 | $ | 9,683 | $ | 3,453 | $ | 2,101 | $ | 7,151 | $ | 855 | $ | 150,167 | ||||||||||||||
| Gross client cash inflows | 4,256 | 519 | 655 | 7,250 | 3,507 | 1,094 | 4,419 | 558 | 489 | 882 | 2,021 | 25,650 | ||||||||||||||||||||||||||
| Gross client cash outflows | (9,652) | (2,685) | (804) | (6,238) | (3,254) | (552) | (2,745) | (887) | (957) | (1,494) | (81) | (29,349) | ||||||||||||||||||||||||||
Net client cash flows (2) | (5,396) | (2,166) | (149) | 1,012 | 253 | 542 | 1,674 | (329) | (468) | (612) | 1,940 | (3,699) | ||||||||||||||||||||||||||
| Artisan Funds’ distributions not reinvested | (112) | (109) | (11) | (507) | (31) | — | (360) | — | (46) | (16) | (1) | (1,193) | ||||||||||||||||||||||||||
| Investment returns and other | 5,407 | 1,484 | 700 | 2,781 | 2,787 | 93 | 945 | 976 | 624 | 21 | 115 | 15,933 | ||||||||||||||||||||||||||
| Ending assets under management | $ | 38,445 | $ | 12,934 | $ | 7,597 | $ | 44,295 | $ | 28,679 | $ | 1,552 | $ | 11,942 | $ | 4,100 | $ | 2,211 | $ | 6,544 | $ | 2,909 | $ | 161,208 | ||||||||||||||
| Average assets under management | $ | 39,403 | $ | 13,688 | $ | 7,454 | $ | 44,170 | $ | 28,029 | $ | 1,414 | $ | 11,040 | $ | 3,917 | $ | 2,282 | $ | 7,096 | $ | 1,739 | $ | 160,232 | ||||||||||||||
| December 31, 2023 | ||||||||||||||||||||||||||||||||||||||
| Beginning assets under management | $ | 33,977 | $ | 13,871 | $ | 6,088 | $ | 30,210 | $ | 21,767 | $ | 873 | $ | 7,140 | $ | 3,466 | $ | 3,676 | $ | 6,752 | $ | 72 | $ | 127,892 | ||||||||||||||
| Gross client cash inflows | 3,730 | 764 | 452 | 8,190 | 2,092 | 138 | 3,623 | 585 | 342 | 722 | 757 | 21,395 | ||||||||||||||||||||||||||
| Gross client cash outflows | (6,570) | (2,759) | (762) | (4,415) | (3,755) | (236) | (2,063) | (1,513) | (2,331) | (1,063) | (4) | (25,471) | ||||||||||||||||||||||||||
Net client cash flows (2) | (2,840) | (1,995) | (310) | 3,775 | (1,663) | (98) | 1,560 | (928) | (1,989) | (341) | 753 | (4,076) | ||||||||||||||||||||||||||
| Artisan Funds’ distributions not reinvested | (11) | (26) | (36) | (325) | (15) | — | (270) | — | — | (1) | — | (684) | ||||||||||||||||||||||||||
| Investment returns and other | 7,420 | 1,875 | 1,315 | 7,349 | 5,581 | 142 | 1,253 | 915 | 414 | 741 | 30 | 27,035 | ||||||||||||||||||||||||||
| Ending assets under management | $ | 38,546 | $ | 13,725 | $ | 7,057 | $ | 41,009 | $ | 25,670 | $ | 917 | $ | 9,683 | $ | 3,453 | $ | 2,101 | $ | 7,151 | $ | 855 | $ | 150,167 | ||||||||||||||
| Average assets under management | $ | 36,541 | $ | 13,849 | $ | 6,514 | $ | 35,990 | $ | 23,332 | $ | 874 | $ | 8,328 | $ | 3,512 | $ | 3,041 | $ | 6,949 | $ | 391 | $ | 139,321 | ||||||||||||||
(1) Effective March 31, 2024, the International Small-Mid team, managing the Non-U.S. Small-Mid Growth strategy, became its own autonomous investment franchise. For comparability purposes, historical AUM for both the Global Equity team and the International Small-Mid team are presented as though they were distinct teams prior to March 31, 2024. | ||||||||||||||||||||||||||||||||||||||
(2) Net client cash flows excludes Artisan Funds’ income and capital gain distributions that were not reinvested. | ||||||||||||||||||||||||||||||||||||||
39
The goal of our marketing, distribution and client service efforts is to establish and maintain a client base that is diversified by investment strategy, client type and distribution channel. As distribution channels have evolved to have more institutional-like decision making processes and longer-term investment horizons, we have expanded our distribution efforts into those areas.
The table below sets forth our AUM by distribution channel:
| As of December 31, 2025 | As of December 31, 2024 | As of December 31, 2023 | |||||||||||||||||||||||||||||||||
| $ in millions | % of total | $ in millions | % of total | $ in millions | % of total | ||||||||||||||||||||||||||||||
Distribution Channel (1) | (unaudited) | (unaudited) | (unaudited) | ||||||||||||||||||||||||||||||||
Intermediated Wealth (2) | $ | 110,469 | 61.4 | % | $ | 94,434 | 58.6 | % | $ | 84,374 | 56.2 | % | |||||||||||||||||||||||
Institutional (2) | 69,459 | 38.6 | % | 66,774 | 41.4 | % | 65,793 | 43.8 | % | ||||||||||||||||||||||||||
| Ending Assets Under Management | $ | 179,928 | 100.0 | % | $ | 161,208 | 100.0 | % | $ | 150,167 | 100.0 | % | |||||||||||||||||||||||
(1) The allocation of AUM by distribution channel involves the use of estimates and the exercise of judgment. | |||||||||||||||||||||||||||||||||||
(2) In the first quarter of 2025, we combined our intermediary and retail distribution channels, which we renamed the intermediated wealth channel, and recategorized certain client AUM to better reflect how management assesses and utilizes this information in the management of the business. Channel information for prior periods was reclassified for comparability purposes. | |||||||||||||||||||||||||||||||||||
Our institutional channel includes AUM sourced from defined contribution plan clients, which made up approximately 7% of our total AUM as of December 31, 2025.
40
The following tables set forth the changes in our AUM by vehicle type:
| Year Ended | Artisan Funds and Artisan Global Funds | Separate Accounts and Other (1) | Total | ||||||||||||||
| December 31, 2025 | (unaudited; in millions) | ||||||||||||||||
| Beginning assets under management | $ | 77,614 | $ | 83,594 | $ | 161,208 | |||||||||||
| Gross client cash inflows | 19,285 | 7,749 | 27,034 | ||||||||||||||
| Gross client cash outflows | (22,447) | (17,249) | (39,696) | ||||||||||||||
Net client cash flows (2) | (3,162) | (9,500) | (12,662) | ||||||||||||||
| Artisan Funds’ distributions not reinvested | (1,982) | — | (1,982) | ||||||||||||||
| Investment returns and other | 15,360 | 18,004 | 33,364 | ||||||||||||||
Net transfers (3) | 45 | (45) | — | ||||||||||||||
| Ending assets under management | $ | 87,875 | $ | 92,053 | $ | 179,928 | |||||||||||
| Average assets under management | $ | 84,106 | $ | 88,898 | $ | 173,004 | |||||||||||
| December 31, 2024 | |||||||||||||||||
| Beginning assets under management | $ | 72,763 | $ | 77,404 | $ | 150,167 | |||||||||||
| Gross client cash inflows | 16,486 | 9,164 | 25,650 | ||||||||||||||
| Gross client cash outflows | (17,297) | (12,052) | (29,349) | ||||||||||||||
Net client cash flows (2) | (811) | (2,888) | (3,699) | ||||||||||||||
| Artisan Funds’ distributions not reinvested | (1,193) | — | (1,193) | ||||||||||||||
| Investment returns and other | 6,901 | 9,032 | 15,933 | ||||||||||||||
Net transfers (3) | (46) | 46 | — | ||||||||||||||
| Ending assets under management | $ | 77,614 | $ | 83,594 | $ | 161,208 | |||||||||||
| Average assets under management | $ | 77,518 | $ | 82,714 | $ | 160,232 | |||||||||||
| December 31, 2023 | |||||||||||||||||
| Beginning assets under management | $ | 60,811 | $ | 67,081 | $ | 127,892 | |||||||||||
| Gross client cash inflows | 15,138 | 6,257 | 21,395 | ||||||||||||||
| Gross client cash outflows | (15,079) | (10,392) | (25,471) | ||||||||||||||
Net client cash flows (2) | 59 | (4,135) | (4,076) | ||||||||||||||
| Artisan Funds’ distributions not reinvested | (684) | — | (684) | ||||||||||||||
| Investment returns and other | 12,592 | 14,443 | 27,035 | ||||||||||||||
Net transfers (3) | (15) | 15 | — | ||||||||||||||
| Ending assets under management | $ | 72,763 | $ | 77,404 | $ | 150,167 | |||||||||||
| Average assets under management | $ | 67,412 | $ | 71,909 | $ | 139,321 | |||||||||||
(1) Separate accounts and other consists of AUM we manage in or through vehicles other than Artisan Funds or Artisan Global Funds. | |||||||||||||||||
(2) Net client cash flows excludes Artisan Funds’ income and capital gain distributions that were not reinvested. | |||||||||||||||||
(3) Net transfers represents certain amounts that we have identified as having been transferred out of one investment strategy, investment vehicle or account and into another strategy, vehicle or account. | |||||||||||||||||
41
The following table sets forth our AUM by asset class:
| Years Ended | Equity (1) | Credit (2) | Alternative (3) | Total | |||||||||||||||||||
| December 31, 2025 | (unaudited; in millions) | ||||||||||||||||||||||
| Beginning assets under management | $ | 143,969 | $ | 13,877 | $ | 3,362 | $ | 161,208 | |||||||||||||||
| Gross client cash inflows | 20,365 | 5,376 | 1,293 | 27,034 | |||||||||||||||||||
| Gross client cash outflows | (35,996) | (2,535) | (1,165) | (39,696) | |||||||||||||||||||
Net client cash flows (4) | (15,631) | 2,841 | 128 | (12,662) | |||||||||||||||||||
Artisan Funds' distributions not reinvested | (1,573) | (379) | (30) | (1,982) | |||||||||||||||||||
| Investment returns and other | 31,253 | 1,538 | 573 | 33,364 | |||||||||||||||||||
| Ending assets under management | $ | 158,018 | $ | 17,877 | $ | 4,033 | $ | 179,928 | |||||||||||||||
| Average assets under management | $ | 153,594 | $ | 15,643 | $ | 3,767 | $ | 173,004 | |||||||||||||||
| December 31, 2024 | |||||||||||||||||||||||
| Beginning assets under management | $ | 137,368 | $ | 10,009 | $ | 2,790 | $ | 150,167 | |||||||||||||||
| Gross client cash inflows | 18,708 | 6,067 | 875 | 25,650 | |||||||||||||||||||
| Gross client cash outflows | (25,548) | (2,793) | (1,008) | (29,349) | |||||||||||||||||||
Net client cash flows (4) | (6,840) | 3,274 | (133) | (3,699) | |||||||||||||||||||
Artisan Funds' distributions not reinvested | (786) | (360) | (47) | (1,193) | |||||||||||||||||||
| Investment returns and other | 14,227 | 954 | 752 | 15,933 | |||||||||||||||||||
| Ending assets under management | $ | 143,969 | $ | 13,877 | $ | 3,362 | $ | 161,208 | |||||||||||||||
| Average assets under management | $ | 145,000 | $ | 11,954 | $ | 3,278 | $ | 160,232 | |||||||||||||||
| December 31, 2023 | |||||||||||||||||||||||
| Beginning assets under management | $ | 116,832 | $ | 7,059 | $ | 4,001 | $ | 127,892 | |||||||||||||||
| Gross client cash inflows | 16,671 | 4,046 | 678 | 21,395 | |||||||||||||||||||
| Gross client cash outflows | (21,072) | (2,059) | (2,340) | (25,471) | |||||||||||||||||||
Net client cash flows (4) | (4,401) | 1,987 | (1,662) | (4,076) | |||||||||||||||||||
Artisan Funds' distributions not reinvested | (414) | (270) | — | (684) | |||||||||||||||||||
| Investment returns and other | 25,351 | 1,233 | 451 | 27,035 | |||||||||||||||||||
| Ending assets under management | $ | 137,368 | $ | 10,009 | $ | 2,790 | $ | 150,167 | |||||||||||||||
| Average assets under management | $ | 127,390 | $ | 8,440 | $ | 3,491 | $ | 139,321 | |||||||||||||||
(1) Equity includes the following investment strategies: U.S. Mid-Cap Growth, U.S. Small-Cap Growth, U.S. Mid-Cap Value, Non-U.S. Growth, International Value, Global Opportunities, Global Equity, Value Equity, Global Value, Sustainable Emerging Markets, Global Discovery, Developing World, Non-U.S. Small-Mid Growth, International Explorer, Select Equity, Value Income and Franchise. | |||||||||||||||||||||||
(2) Credit includes the following investment strategies: High Income, Floating Rate, Emerging Markets Debt Opportunities, Emerging Markets Local Opportunities and Custom Credit Solutions. | |||||||||||||||||||||||
(3) Alternative includes the following investment strategies: Antero Peak, Antero Peak Hedge, China Post-Venture, Credit Opportunities, Global Unconstrained and Global Special Situations. | |||||||||||||||||||||||
(4) Net client cash flows excludes Artisan Funds’ income and capital gain distributions that were not reinvested. | |||||||||||||||||||||||
42
Artisan Investment Vehicles
The following table sets forth AUM as of and total revenue for the year ended December 31, 2025 for our various investment vehicles:
| Artisan Funds | Artisan Global Funds | Separate Accounts and Other | |||||||||||||||
| (in millions) | |||||||||||||||||
| AUM | $ | 78,844 | $ | 9,031 | $ | 92,053 | |||||||||||
| Percent of total AUM | 44 | % | 5 | % | 51 | % | |||||||||||
| Revenues | $ | 683.5 | $ | 58.3 | $ | 454.9 | |||||||||||
| Percent of total revenue | 57 | % | 5 | % | 38 | % | |||||||||||
Artisan Funds and Artisan Global Funds have contractual tiered fees rates that depend on the investment strategy, the amount of shareholder investment and other factors. Our contractual tiered fee rates for the series of Artisan Funds and Artisan Global Funds range from 0.60% to 1.05% of fund assets and 0.35% to 1.85% of AUM, respectively.
The “separate accounts and other” category consists of assets we manage in or through vehicles other than Artisan Funds or Artisan Global Funds, including traditional separate accounts, Artisan-branded collective investment trusts and Artisan Private Funds, as well as certain Custom Credit Solutions, which represent assets managed by the Credit team within custom, investor-driven mandates. In addition, assets under advisement related to clients for whom we provide investment models but do not have discretionary investment authority are also included within the “separate accounts and other” category.
Traditional separate account clients are generally subject to standard fee schedules that vary by investment strategy and, through the application of standard breakpoints, reflect the size of the account and client relationship. There are a number of exceptions to our standard fee schedules, including exceptions based on the nature of a client relationship and the aggregate value of a client’s assets under our management.
Some of our strategies are also accessible to certain types of employee benefit plans through Artisan-branded collective investment trusts. We act as investment adviser to the collective investment trusts and earn a management fee for providing this service.
Artisan serves as the investment manager and acts as the general partner for certain Artisan Private Funds. Under the terms of these agreements, Artisan earns a management fee, and for certain funds is entitled to receive either an allocation of profits or a performance-based fee.
The following table sets forth the weighted average fee rates across our products for the years ended December 31, 2025, 2024 and 2023:
| For the Years Ended December 31, | |||||||||||||||||
| 2025 | 2024 | 2023 | |||||||||||||||
| Artisan Funds and Artisan Global Funds | 0.883 | % | 0.887 | % | 0.901 | % | |||||||||||
| Separate accounts and other (total) | 0.513 | % | 0.512 | % | 0.519 | % | |||||||||||
| Traditional separate accounts | 0.482 | % | 0.490 | % | 0.491 | % | |||||||||||
| Collective investment trusts | 0.699 | % | 0.701 | % | 0.665 | % | |||||||||||
| Private funds | 0.773 | % | 0.558 | % | 0.654 | % | |||||||||||
As is typical in the asset management industry, our rates of fee decline as the assets under our management in a relationship increase, and because of differences in our fees by investment strategy or investment vehicle, a change in the composition of our AUM, in particular a shift of assets to strategies or vehicles with lower effective rates of fees, could have a material impact on our overall weighted average rate of fee. See “—Qualitative and Quantitative Disclosures Regarding Market Risk—Market Risk” for a sensitivity analysis that demonstrates the impact that certain changes in the composition of our AUM could have on our revenues.
Investment Advisory Revenues
Essentially all of our revenues consist of fees earned from managing clients’ assets. Investment advisory fees, which are comprised of management fees and performance fees (including incentive allocations), fluctuate based on a number of factors, including the total value of our AUM, the composition of AUM among investment vehicles and investment strategies, changes in the fee rates on our products, the extent to which we enter into fee arrangements that differ from our standard fee schedules, which can be affected by custom and the competitive landscape in the relevant market, and, for the accounts on which we earn performance fees, the investment performance of those accounts.
43
The different fee structures associated with Artisan Funds, Artisan Global Funds and separate accounts and other pooled vehicles, and the different fee schedules applicable to each of our investment strategies, make the composition of our AUM an important determinant of the investment advisory fees we earn. Historically, we have received higher effective rates of fees from Artisan Funds and Artisan Global Funds than from traditional separate accounts, reflecting, among other things, the different and broader array of services we provide to Artisan Funds and Artisan Global Funds. Our fees also differ by investment strategy, with higher-capacity strategies having lower standard fee rates than strategies with more limited capacity.
Certain separate account clients pay us fees based on the performance of their accounts relative to agreed-upon benchmarks, which typically results in a lower base fee, but allows us to earn higher fees if the performance we achieve for that client is superior to the performance of the agreed-upon benchmark. We may also receive performance fees or incentive allocations from Artisan Private Funds. Approximately 3% of our $179.9 billion of AUM as of December 31, 2025, have performance fee billing arrangements.
The following table sets forth revenues we earned by vehicle type for the years ended December 31, 2025, 2024 and 2023:
| For the Years Ended December 31, | |||||||||||||||||
| 2025 | 2024 | 2023 | |||||||||||||||
| Revenues | (in millions) | ||||||||||||||||
| Management fees | |||||||||||||||||
| Artisan Funds and Artisan Global Funds | $ | 741.8 | $ | 688.8 | $ | 606.3 | |||||||||||
| Separate accounts and other | 425.8 | 408.2 | 364.5 | ||||||||||||||
| Performance fees | 29.1 | 14.8 | 4.3 | ||||||||||||||
| Total revenues | $ | 1,196.7 | $ | 1,111.8 | $ | 975.1 | |||||||||||
Management fees and performance fees (including incentive allocations) earned from consolidated investment products are eliminated from revenue upon consolidation.
For the years ended December 31, 2025, 2024 and 2023, approximately 80%, 80% and 82%, respectively, of our investment advisory fees were earned from clients located in the United States.
Operating Expenses
Our operating expenses consist primarily of compensation and benefits, distribution, servicing and marketing, occupancy, communication and technology and general and administrative expenses.
Our expenses fluctuate due to a number of factors, including the following:
•variations in the amount of total compensation expense due to, among other things, changes in the amount of incentive compensation earned and long-term incentive awards made, variations in our employee count (including the addition of new investment teams), changes in our product mix and other competitive factors; and
•expenses, such as distribution fees, rent, professional service fees, technology and data-related costs, that are incurred to operate and grow our business.
A significant portion of our operating expenses are variable and fluctuate in direct relation to our AUM and revenues. Even if we experience declining revenues, we expect to continue to make the expenditures necessary for us to manage and grow our business. As a result, our profits may decline.
Compensation and Benefits
Compensation and benefits includes (i) salaries, incentive compensation and benefits costs and (ii) long-term incentive compensation expense related to equity and cash awards granted to employees.
Incentive compensation comprises a significant portion of our senior employees’ total compensation. The amount of incentive compensation paid to members of our investment teams and distribution team is based in large part on formulas that are tied directly to revenues. For each of our investment teams, incentive compensation generally represents 25% of the asset-based management fees and a share of performance-based fees generated by the AUM in the team’s strategy or strategies. Incentive compensation paid to most other employees is discretionary and determined based on individual performance and our overall results during the applicable year.
The Company is primarily self-insured for health benefits up to certain annual stop-loss limits. Expense is recognized based on claims filed and an estimate of claims incurred but not yet reported, as determined by an independent third party.
Fixed compensation costs are comprised primarily of salaries, benefits and long-term incentive compensation expense. Fixed compensation costs, exclusive of long-term incentive compensation, are expected to increase mid-single digits in 2026 reflecting merit increases and anticipated growth in our number of full-time employees, including the Grandview acquisition. Certain compensation and benefits expenses are generally higher in the beginning of the year, including employer funded retirement and health care contributions and payroll taxes. We expect these expenses will add approximately $6 million to our expenses in the first quarter of 2026, compared to the fourth quarter of 2025.
44
Equity awards granted to our employees consist of standard restricted awards that generally vest on a pro rata basis over 5 years and career awards that vest when both of the following conditions are met (1) pro-rata time vesting over 5 years and (2) a qualifying retirement (as defined in the award agreements). Beginning with the 2024 grant, the pro rata 5-year vesting requirement is waived when a career award recipient has a qualified retirement after having met an age-plus-service condition. Career vesting awards granted to investment team members are generally further subject to the Franchise Protection Clause, which applies to current or future portfolio managers and founding investment team members. The Franchise Protection Clause provides that the total number of career awards ultimately vesting will be reduced to the extent that cumulative net client cash outflows from the award recipient’s investment team during a specified measurement period exceeds a set threshold.
Performance share units (“PSUs”) were granted to certain executive officers of the Company in 2020, 2021 and 2022 with the amount of shares vesting dependent on the Company’s adjusted operating margin and total stockholder return relative to a peer group over a three year measurement period. As of December 31, 2025, all outstanding PSUs had met the required performance conditions, but remain outstanding subject to meeting a qualifying retirement vesting condition.
The estimated grant date fair value of equity awards is recognized as compensation expense on a straight-line basis over the requisite service period of the award. The initial requisite service period is generally five years for restricted stock awards and restricted stock units, and was three years for PSUs. If an employee is eligible to fully vest in an award upon a qualified retirement, the initial requisite service period is equal to the employee’s required retirement notice period, which is generally either 12 or 18 months.
We grant cash-based long-term incentive awards, referred to as franchise capital awards, to certain investment team members in lieu of equity awards. Franchise capital awards are subject to the same vesting and forfeiture provisions as the equity awards. Prior to vesting, franchise capital awards are generally allocated to one or more of Artisan’s investment strategies. The underlying investment holdings and franchise capital award liability are marked to market value each quarter. The change in value of the award liability is included in compensation expense. The change in value of the underlying investment holdings is included in non-operating income/(expense).
We expect to reserve approximately 4% of our management fee revenues each quarter for future franchise capital awards, which we expect to make after the conclusion of each year. Over the long-term, we believe the economic impact of the reduced cash available for dividends will be offset by a corresponding reduction in dilution, as we expect to grant fewer equity awards as a result of the franchise capital awards.
During the first quarter of 2026, the Board approved the annual grant of long-term incentive awards with a grant date fair value of $71.8 million consisting of $21.2 million of restricted share-based awards and $50.6 million of franchise capital awards, to certain employees pursuant to the Company’s 2023 Omnibus Incentive Compensation Plan. The grant will be effective March 2, 2026.
Since the IPO, and including the grant in the first quarter of 2026, our Board has approved equity grants of 13,282,409 restricted share-based awards. Total unrecognized non-cash compensation expense for these awards is $66.0 million. As of the date of this filing, unvested equity awards consist of the following number of shares by vesting condition:
| Service Only | Service & Performance Conditions | Service & Market Conditions | Total | |||||||||||||||||||||||
| Standard Pro Rata 5-Year Vesting | 891,320 | — | — | 891,320 | ||||||||||||||||||||||
| Qualified Retirement | 2,735,125 | 1,550,911 | 38,985 | 4,325,021 | ||||||||||||||||||||||
| Total Unvested | 3,626,445 | 1,550,911 | 38,985 | 5,216,341 | ||||||||||||||||||||||
Including the long-term incentive award approved in the first quarter of 2026, total unrecognized long-term incentive compensation expense (including both equity grants and franchise capital awards) is $235.4 million. Long-term incentive compensation expense in 2026 is expected to be approximately $85.0 million, excluding the impact of forfeitures and investment returns on the franchise capital awards’ underlying investments. The retirement acceleration feature added to certain awards granted beginning in 2024 results in higher amortization expense relative to prior awards which did not accelerate upon retirement. The incremental impact of the retirement acceleration feature will decrease over time, and we currently expect the impact on 2027 compensation expense to be approximately $5 million lower than the impact on 2026 compensation expense.
We expect to continue to make annual long-term incentive awards each year, though the form and structure of the awards may change as we seek to maximize alignment between our associates and our clients and stockholders. The actual amount of the expense over time will depend primarily on the size of awards made. The size of the annual long-term incentive awards will vary from year to year and will be influenced by our results and other factors. From time to time, we may also grant individual long-term incentive awards in connection with talent acquisition and retention.
45
Distribution, Servicing and Marketing
Distribution, servicing and marketing expenses primarily represent payments we make to broker-dealers, financial advisors, defined contribution plan providers, mutual fund supermarkets and other intermediaries for selling, servicing and administering accounts invested in shares of Artisan Funds. Artisan Funds authorizes intermediaries to accept purchase, exchange and redemption orders for shares of Artisan Funds on its behalf. Many intermediaries charge a fee for those services. Artisan Funds pays a portion of some of those fees, which portion is intended to compensate the intermediary for its provision of services of the type that would be provided by Artisan Funds’ transfer agent or other service providers if the shares were registered directly on the books of Artisan Funds’ transfer agent. Like the investment management fees we earn as adviser to Artisan Funds, distribution, servicing and marketing fees typically vary with the value of the assets invested in shares of Artisan Funds. The allocation of such fees between us and Artisan Funds is determined by the board of Artisan Funds, based on information and a recommendation provided by us, with the goal of allocating to us, at a minimum, all costs attributable to the marketing and distribution of shares of Artisan Funds. A significant portion of Artisan Funds’ shares are held by investors through intermediaries to which we pay distribution, servicing and marketing expenses.
Total distribution, servicing and marketing fees will increase as we increase our AUM sourced through intermediaries that charge these fees or similar fees. The amount we pay to intermediaries for distribution and administrative services varies by share class. As assets have transferred from the Investor share class to the Advisor and Institutional share classes, the amount we have paid for distribution, servicing and marketing relative to average AUM in the Artisan Funds has decreased. Consistent with the experience of other investment managers, as the foregoing expenses have decreased, we have seen increased requests from intermediaries for alternative forms of compensation. To date, such alternative forms of compensation have not been material, but they could be over time.
Occupancy
Occupancy expenses include operating leases for facilities, furniture and office equipment, miscellaneous facility related costs and depreciation expense associated with furniture purchases and leasehold improvements.
Communication and technology
Communication and technology expenses include information and data subscriptions, telecommunication device and data costs, information systems consulting fees, equipment and software maintenance expenses, operating leases for information technology equipment and depreciation and amortization expenses associated with computer hardware and software. Information and data subscriptions represent the costs we pay to obtain investment research and other data we need to operate our business. A portion of these expenses generally increase or decrease in relative proportion to the number of our employees and the overall size and scale of our business operations. We expect to continue our measured investments in technology to support our investment teams, distribution efforts and scalable operations.
On behalf of our clients, we make decisions to buy and sell securities, select broker-dealers to execute trades and negotiate brokerage commission rates. In connection with these transactions, we receive research products and services from broker-dealers in exchange for the business we conduct with such firms. Some of those research products and services could be acquired for cash and our receipt of those products and services through the use of client commissions, or soft dollars, reduces cash expenses we would otherwise incur. In response to the Markets in Financial Instruments Directive II and industry changes prompted by it, we have in the past experienced requests from clients to bear research expenses that are currently paid for using soft dollars. In response to such requests or as a result of changes in our operations, we may eventually bear more of the costs of research that are currently paid for using soft dollars, which could increase our operating expenses materially.
General and Administrative
General and administrative expenses include professional fees, travel and entertainment, certain state and local taxes, directors’ and officers’ liability insurance, director fees and other miscellaneous expenses we incur in operating our business.
We expect 2026 Occupancy, Communication and technology and General and administrative expenses in the aggregate to increase by mid-single digits compared to 2025.
Non-Operating Income (Expense)
Interest Expense
Interest expense primarily relates to the interest we pay on our debt. For a description of the terms of our debt, see “—Liquidity, Capital Resources, and Contractual Obligations”. Interest expense also includes interest on TRA payments, which is incurred between the due date (without extension) for APAM’s federal income tax return and the date on which APAM makes TRA payments.
Interest Income on Cash and Cash Equivalents and Other
Interest income on cash and cash equivalents and other includes income earned from investing excess operating cash in various money market funds.
46
Net Gain (Loss) on the Tax Receivable Agreements
Non-operating income (expense) also includes gains or losses related to the changes in our estimate of the payment obligation under the TRAs, including the impact of tax rate changes. The effect of changes in our estimate of amounts payable under the TRAs, including the effect of changes in enacted tax rates and in applicable tax laws, is included in net income.
Net Investment Gain (Loss) of Consolidated Investment Products
Net investment gain (loss) of consolidated investment products represents the realized and unrealized investment gains (losses) related to investment products that are included in our consolidated financial statements because Artisan holds a controlling financial interest in the respective investment entities. Significant portions of net investment gain (loss) of consolidated investment products are offset by noncontrolling interests in our Consolidated Statements of Operations.
Net Investment Gain (Loss) of Nonconsolidated Investment Products
Net investment gain (loss) of nonconsolidated investment products includes realized and unrealized investment gains (losses) related to nonconsolidated investment products and dividends earned on nonconsolidated equity securities.
Net Income (Loss) Attributable to Noncontrolling Interests
Net Income (Loss) Attributable to Noncontrolling Interests - Holdings
Net income (loss) attributable to noncontrolling interests - Holdings represents the portion of earnings or loss attributable to the ownership interests in Artisan Partners Holdings held by the limited partners of Artisan Partners Holdings.
Net Income (Loss) Attributable to Noncontrolling Interests - Consolidated Investment Products
Net income (loss) attributable to noncontrolling interests - consolidated investment products represents the portion of earnings or loss attributable to third-party investors’ ownership interests in consolidated investment products.
Provision for Income Taxes
The provision for income taxes primarily represents APAM’s U.S. federal, state and local income taxes on its allocable portion of Holdings’ income, as well as foreign income taxes payable by Holdings’ subsidiaries. Our effective income tax rate is dependent on many factors, including a rate benefit attributable to the fact that a portion of Holdings’ taxable earnings are not subject to corporate level taxes. Thus, income before income taxes includes amounts that are attributable to noncontrolling interests and not taxable to APAM and its subsidiaries, which reduces the effective tax rate. The effective tax rate is also lower than the statutory rate due to dividends paid on unvested share-based awards. These favorable impacts are partially offset by the impact of permanent items, including certain executive compensation expenses, that are not deductible for tax purposes.
As APAM’s equity ownership in Holdings increases, the effective tax rate will likewise increase as more income will be subject to corporate-level taxes.
We currently estimate that our GAAP and adjusted effective tax rates will increase 1% to 3% beginning in 2027 as a result of the compensation deduction limitation rules within the One Big Beautiful Bill Act (“OBBBA”).
47
Results of Operations
Year Ended December 31, 2025, Compared to Year Ended December 31, 2024
| For the Years Ended December 31, | Period-to-Period | ||||||||||||||||||||||
| 2025 | 2024 | $ | % | ||||||||||||||||||||
| Statements of operations data: | (in millions, except share and per-share data) | ||||||||||||||||||||||
| Revenues | |||||||||||||||||||||||
| Management fees | $ | 1,167.6 | $ | 1,097.0 | $ | 70.6 | 6 | % | |||||||||||||||
| Performance fees | 29.1 | 14.8 | 14.3 | 97 | % | ||||||||||||||||||
| Total revenues | 1,196.7 | 1,111.8 | 84.9 | 8 | % | ||||||||||||||||||
| Operating Expenses | |||||||||||||||||||||||
| Total compensation and benefits | 649.6 | 594.1 | 55.5 | 9 | % | ||||||||||||||||||
| Other operating expenses | 147.5 | 151.1 | (3.6) | (2) | % | ||||||||||||||||||
| Total operating expenses | 797.1 | 745.2 | 51.9 | 7 | % | ||||||||||||||||||
| Total operating income | 399.6 | 366.6 | 33.0 | 9 | % | ||||||||||||||||||
| Non-operating income (expense) | |||||||||||||||||||||||
| Interest expense | (8.6) | (8.6) | — | — | % | ||||||||||||||||||
| Other non-operating income (expense) | 98.1 | 82.6 | 15.5 | 19 | % | ||||||||||||||||||
| Total non-operating income (expense) | 89.5 | 74.0 | 15.5 | 21 | % | ||||||||||||||||||
| Income before income taxes | 489.1 | 440.6 | 48.5 | 11 | % | ||||||||||||||||||
| Provision for income taxes | 111.3 | 90.9 | 20.4 | 22 | % | ||||||||||||||||||
| Net income before noncontrolling interests | 377.8 | 349.7 | 28.1 | 8 | % | ||||||||||||||||||
| Less: Noncontrolling interests - Artisan Partners Holdings | 58.2 | 52.9 | 5.3 | 10 | % | ||||||||||||||||||
| Less: Noncontrolling interests - consolidated investment products | 29.3 | 37.1 | (7.8) | (21) | % | ||||||||||||||||||
| Net income attributable to Artisan Partners Asset Management Inc. | $ | 290.3 | $ | 259.7 | $ | 30.6 | 12 | % | |||||||||||||||
| Share Data | |||||||||||||||||||||||
| Basic earnings per share | $ | 4.05 | $ | 3.66 | |||||||||||||||||||
| Diluted earnings per share | $ | 4.05 | $ | 3.66 | |||||||||||||||||||
| Basic weighted average number of common shares outstanding | 65,603,942 | 64,900,228 | |||||||||||||||||||||
| Diluted weighted average number of common shares outstanding | 65,603,942 | 64,939,183 | |||||||||||||||||||||
Revenues
The increase in revenues of $84.9 million, or 8%, for the year ended December 31, 2025, compared to the year ended December 31, 2024, was driven primarily by a $12.8 billion, or 8%, increase in our average AUM and a $14.3 million increase in performance fee revenue. The increase in performance fee revenue resulted from higher relative investment outperformance in products with performance fee billing arrangements.
The weighted average fee rate, inclusive of performance fees, was 69.3 basis points for the year ended December 31, 2025, compared to 69.5 basis points for the year ended December 31, 2024. The following table sets forth investment advisory fees and the weighted average fee by investment vehicle. The weighted average fee for Artisan Funds and Artisan Global Funds reflects the additional services we provide to these pooled vehicles.
48
Separate Accounts and Other (1) | Artisan Funds and Artisan Global Funds | ||||||||||||||||||||||
| For the Years Ended December 31, | 2025 | 2024 | 2025 | 2024 | |||||||||||||||||||
| (dollars in millions) | |||||||||||||||||||||||
| Investment advisory fees | $ | 454.9 | $ | 423.0 | $ | 741.8 | $ | 688.8 | |||||||||||||||
Weighted average fee (2) | 51.3 bps | 51.2 bps | 88.3 bps | 88.7 bps | |||||||||||||||||||
| Percentage of ending AUM | 51 | % | 52 | % | 49 | % | 48 | % | |||||||||||||||
(1) Separate accounts and other consists of assets we manage in or through vehicles other than Artisan Funds or Artisan Global Funds. | |||||||||||||||||||||||
(2) We compute our weighted average fee by dividing annualized investment management fees, inclusive of performance fees, by average AUM for the applicable period. Prior to December 2025, we presented weighted average management fee, which was exclusive of performance fees. Historical figures have been recast for comparability. | |||||||||||||||||||||||
Operating Expenses
Compensation and Benefits
| For the Years Ended December 31, | Period-to-Period | ||||||||||||||||||||||
| 2025 | 2024 | $ | % | ||||||||||||||||||||
| (in millions) | |||||||||||||||||||||||
Salaries, incentive compensation and benefits (1) | $ | 552.6 | $ | 521.0 | $ | 31.6 | 6 | % | |||||||||||||||
| Long-term incentive compensation awards | 97.0 | 73.1 | 23.9 | 33 | % | ||||||||||||||||||
Total compensation and benefits | $ | 649.6 | $ | 594.1 | $ | 55.5 | 9 | % | |||||||||||||||
(1) Excluding long-term incentive compensation awards. | |||||||||||||||||||||||
The increase in total compensation and benefits was driven by a $26.4 million increase in incentive compensation primarily related to increased revenues and a $23.9 million increase in long-term incentive compensation, which included a $15.3 million increase due to changes in the market value of outstanding long-term incentive awards.
Total compensation and benefits was 54% and 53% of our revenues for the years ended December 31, 2025 and 2024, respectively.
Other operating expenses
Other operating expenses decreased $3.6 million for the year ended December 31, 2025, compared to the year ended December 31, 2024, primarily due to a decrease in general and administrative costs, most notably decreases in travel and entertainment costs, occupancy-related abandonment charges and professional fees.
49
Non-Operating Income (Expense)
Non-operating income (expense) consisted of the following:
| For the Years Ended December 31, | Period-to-Period | ||||||||||||||||||||||
| 2025 | 2024 | $ | % | ||||||||||||||||||||
| (in millions) | |||||||||||||||||||||||
| Net investment gain (loss) of consolidated investment products | $ | 47.4 | $ | 52.0 | $ | (4.6) | (9) | % | |||||||||||||||
| Net investment gain (loss) on nonconsolidated seed investments | 8.7 | 7.0 | 1.7 | 24 | % | ||||||||||||||||||
| Net investment gain (loss) on nonconsolidated franchise capital investments | 32.0 | 14.5 | 17.5 | 121 | % | ||||||||||||||||||
| Total net investment gain (loss) | $ | 88.1 | $ | 73.5 | 14.6 | 20 | % | ||||||||||||||||
| Interest expense | (8.6) | (8.6) | — | — | % | ||||||||||||||||||
| Interest income on cash and cash equivalents and other | 9.4 | 9.6 | (0.2) | (2) | % | ||||||||||||||||||
| Net gain (loss) on the tax receivable agreements | 0.6 | (0.5) | 1.1 | 220 | % | ||||||||||||||||||
Total non-operating income (expense) | $ | 89.5 | $ | 74.0 | $ | 15.5 | 21 | % | |||||||||||||||
Net investment gain (loss) of consolidated investment products, net investment gain (loss) on nonconsolidated seed investments and net investment gain (loss) on franchise capital investments increased $14.6 million in aggregate for the year ended December 31, 2025, compared to the year ended December 31, 2024, predominantly due to market conditions.
Artisan’s share of the $88.1 million total investment gains for the year ended December 31, 2025 was $58.0 million, comprised of $36.1 million of gains on investments to hedge compensation plans and $21.9 million of gains on seed investments. $30.1 million of the total investment gains for the year ended December 31, 2025 were attributable to noncontrolling interests.
Provision for Income Taxes
APAM’s effective income tax rate for the years ended December 31, 2025 and 2024 was 22.7% and 20.6%, respectively. The increase in effective tax rate was primarily due to the enactment of the OBBBA, which increased the effective tax rate by 2.2%.
Several factors contribute to the effective tax rate, including a rate benefit attributable to the fact that approximately 14% of Holdings’ full year projected taxable earnings were not subject to corporate-level taxes for the years ended December 31, 2025 and 2024. Thus, income before income taxes includes amounts that are attributable to noncontrolling interests and not taxable to APAM and its subsidiaries, which reduces the effective tax rate. As APAM’s equity ownership in Holdings increases, the effective tax rate will likewise increase as more income will be subject to corporate-level taxes. The effective tax rate was favorably impacted in both periods due to tax deductible dividends paid on unvested restricted share-based awards.
Earnings Per Share
Weighted average basic and diluted shares of Class A common stock outstanding were higher for the year ended December 31, 2025, compared to the year ended December 31, 2024, as a result of unit exchanges and equity award grants. See Note 12, “Earnings Per Share” in the Notes to the consolidated financial statements in Item 8 of this report for further discussion of earnings per share.
50
Year Ended December 31, 2024, Compared to the Year Ended December 31, 2023
| For the Years Ended December 31, | For the Period-to-Period | ||||||||||||||||||||||
| 2024 | 2023 | $ | % | ||||||||||||||||||||
| Statements of operations data: | (in millions, except share and per-share data) | ||||||||||||||||||||||
| Revenues | |||||||||||||||||||||||
| Management fees | $ | 1,097.0 | $ | 970.8 | $ | 126.2 | 13 | % | |||||||||||||||
| Performance fees | 14.8 | 4.3 | 10.5 | 244 | % | ||||||||||||||||||
| Total revenues | 1,111.8 | 975.1 | 136.7 | 14 | % | ||||||||||||||||||
| Operating Expenses | |||||||||||||||||||||||
| Total compensation and benefits | 594.1 | 529.4 | 64.7 | 12 | % | ||||||||||||||||||
| Other operating expenses | 151.1 | 142.1 | 9.0 | 6 | % | ||||||||||||||||||
| Total operating expenses | 745.2 | 671.5 | 73.7 | 11 | % | ||||||||||||||||||
| Total operating income | 366.6 | 303.6 | 63.0 | 21 | % | ||||||||||||||||||
| Non-operating income (expense) | |||||||||||||||||||||||
| Interest expense | (8.6) | (8.6) | — | — | % | ||||||||||||||||||
| Other non-operating income | 82.6 | 88.7 | (6.1) | (7) | % | ||||||||||||||||||
| Total non-operating income (expense) | 74.0 | 80.1 | (6.1) | (8) | % | ||||||||||||||||||
| Income before income taxes | 440.6 | 383.7 | 56.9 | 15 | % | ||||||||||||||||||
| Provision for income taxes | 90.9 | 71.9 | 19.0 | 26 | % | ||||||||||||||||||
| Net income before noncontrolling interests | 349.7 | 311.8 | 37.9 | 12 | % | ||||||||||||||||||
| Less: Noncontrolling interests - Artisan Partners Holdings | 52.9 | 49.5 | 3.4 | 7 | % | ||||||||||||||||||
| Less: Noncontrolling interests - consolidated investment products | 37.1 | 40.0 | (2.9) | (7) | % | ||||||||||||||||||
| Net income attributable to Artisan Partners Asset Management Inc. | $ | 259.7 | $ | 222.3 | $ | 37.4 | 17 | % | |||||||||||||||
| Share Data | |||||||||||||||||||||||
| Basic earnings per share | $ | 3.66 | $ | 3.19 | |||||||||||||||||||
| Diluted earnings per share | $ | 3.66 | $ | 3.19 | |||||||||||||||||||
| Basic weighted average number of common shares outstanding | 64,900,228 | 63,451,932 | |||||||||||||||||||||
| Diluted weighted average number of common shares outstanding | 64,939,183 | 63,486,479 | |||||||||||||||||||||
A detailed discussion of the year-over-year results for the year ended December 31, 2024, compared to the year ended December 31, 2023, can be found in “Item 7—Management’s Discussion and Analysis of Financial Condition and Results of Operations” of our Annual Report on Form 10-K for the fiscal year ended December 31, 2024, filed with the SEC on February 25, 2025.
51
Supplemental Non-GAAP Financial Information
Our management uses non-GAAP measures (referred to as “adjusted” measures) of net income to evaluate the profitability and efficiency of the underlying operations of our business and as a factor when considering net income available for distributions and dividends. These adjusted measures remove the impact of (1) net gain (loss) on the tax receivable agreements (if any), (2) compensation expense (reversal) related to market valuation changes in compensation plans, (3) net investment gain (loss) of investment products, (4) non-recurring expenses and (5) the adjustment to deferred taxes as a result of the OBBBA enactment. These adjusted measures also remove the non-operational complexities of our structure by adding back noncontrolling interests and assuming all income of Artisan Partners Holdings is allocated to APAM. Management believes these non-GAAP measures provide meaningful information to analyze our profitability and efficiency between periods and over time. We have included these non-GAAP measures to provide investors with the same financial metrics used by management to manage the Company.
Non-GAAP measures should be considered in addition to, and not as a substitute for, financial measures prepared in accordance with GAAP. Our non-GAAP measures may differ from similar measures used by other companies, even if similar terms are used to identify such measures. Our non-GAAP measures are as follows:
•Adjusted net income represents net income excluding the impact of (1) net gain (loss) on the tax receivable agreements (if any), (2) compensation expense (reversal) related to market valuation changes in compensation plans, (3) net investment gain (loss) of investment products, (4) non-recurring expenses and (5) the adjustment to deferred taxes as a result of the OBBBA enactment. Adjusted net income also reflects income taxes assuming the vesting of all unvested Class A share-based awards and as if all outstanding limited partnership units of Artisan Partners Holdings had been exchanged for Class A common stock of APAM on a one-for-one basis. Assuming full vesting and exchange, all income of Artisan Partners Holdings is treated as if it were allocated to APAM, and the adjusted provision for income taxes represents an estimate of income tax expense at an effective rate reflecting APAM’s current federal, state and local income statutory tax rates. The adjusted tax rate was 24.7% for all periods presented.
•Adjusted net income per adjusted share is calculated by dividing adjusted net income by adjusted shares. The number of adjusted shares is derived by assuming the vesting of all unvested Class A share-based awards and the exchange of all outstanding limited partnership units of Artisan Partners Holdings for Class A common stock of APAM on a one-for-one basis.
•Adjusted operating income represents the operating income of the consolidated company excluding compensation expense related to market valuation changes in compensation plans and non-recurring expenses.
•Adjusted operating margin is calculated by dividing adjusted operating income by total revenues.
•Adjusted EBITDA represents adjusted net income before interest expense, income taxes, depreciation and amortization expense.
Net gain (loss) on the tax receivable agreements represents the income (expense) associated with the change in estimate of amounts payable under the tax receivable agreements entered into in connection with APAM’s initial public offering and related reorganization.
Compensation expense (reversal) related to market valuation changes in compensation plans represents the expense (income) associated with the change in the long-term incentive award liability resulting from investment returns of the underlying investment products. Because the compensation expense impact of the investment market exposure is economically hedged, management believes it is useful to reflect the expected net income offset in the calculation of adjusted operating income, adjusted net income and adjusted EBITDA. The related investment gain (loss) on the underlying investments is included in the adjustment for net investment gain (loss) of investment products.
Net investment gain (loss) of investment products represents the non-operating income (expense) related to the Company’s investments, in both consolidated investment products and nonconsolidated investment products, including investments held to economically hedge compensation plans. Excluding these non-operating market gains or losses on investments provides greater transparency to evaluate the profitability and efficiency of the underlying operations of the business. Interest income generated on cash and cash equivalents is considered part of normal operations, and therefore, is not excluded from adjusted net income.
Non-recurring expenses represents non-recurring professional fees that are not reflective of core operations.
The adjustment to income tax expense as a result of the OBBBA enactment relates to the remeasurement of deferred tax assets upon its enactment, specifically associated with new compensation deduction limitation rules effective for the Company starting in 2027.
52
The following table sets forth, for the periods indicated, a reconciliation from GAAP financial measures to non-GAAP measures:
| For the Years Ended December 31, | |||||||||||||||||
| 2025 | 2024 | 2023 | |||||||||||||||
| Reconciliation of non-GAAP financial measures: | |||||||||||||||||
| Net income attributable to Artisan Partners Asset Management Inc. (GAAP) | $ | 290.3 | $ | 259.7 | $ | 222.3 | |||||||||||
Add back: Net income attributable to noncontrolling interests - Artisan Partners Holdings | 58.2 | 52.9 | 49.5 | ||||||||||||||
| Add back: Provision for income taxes | 111.3 | 90.9 | 71.9 | ||||||||||||||
| Add back: Compensation expense (reversal) related to market valuation changes in compensation plans | 23.0 | 7.8 | 4.8 | ||||||||||||||
| Add back: Net (gain) loss on the tax receivable agreements | (0.6) | 0.5 | (0.5) | ||||||||||||||
| Add back: Net investment (gain) loss of investment products attributable to APAM | (58.0) | (31.9) | (38.4) | ||||||||||||||
| Add back: Non-recurring expenses | — | 1.6 | — | ||||||||||||||
| Less: Adjusted provision for income taxes | 104.8 | 94.2 | 76.5 | ||||||||||||||
| Adjusted net income (Non-GAAP) | $ | 319.4 | $ | 287.3 | $ | 233.1 | |||||||||||
| Average shares outstanding | |||||||||||||||||
| Class A common shares | 65.6 | 64.9 | 63.4 | ||||||||||||||
| Assumed vesting or exchange of: | |||||||||||||||||
| Unvested Class A restricted share-based awards | 5.3 | 5.5 | 5.7 | ||||||||||||||
| Artisan Partners Holdings units outstanding (noncontrolling interests) | 10.2 | 10.5 | 11.5 | ||||||||||||||
| Adjusted shares | 81.1 | 80.9 | 80.6 | ||||||||||||||
| Basic earnings per share (GAAP) | $ | 4.05 | $ | 3.66 | $ | 3.19 | |||||||||||
| Diluted earnings per share (GAAP) | $ | 4.05 | $ | 3.66 | $ | 3.19 | |||||||||||
| Adjusted net income per adjusted share (Non-GAAP) | $ | 3.93 | $ | 3.55 | $ | 2.89 | |||||||||||
| Operating income (GAAP) | $ | 399.6 | $ | 366.6 | $ | 303.6 | |||||||||||
| Add back: Compensation expense (reversal) related to market valuation changes in compensation plans | 23.0 | 7.8 | 4.8 | ||||||||||||||
| Add back: Non-recurring expenses | — | 1.6 | — | ||||||||||||||
| Adjusted operating income (Non-GAAP) | $ | 422.6 | $ | 376.0 | $ | 308.4 | |||||||||||
| Operating margin (GAAP) | 33.4 | % | 33.0 | % | 31.1 | % | |||||||||||
| Adjusted operating margin (Non-GAAP) | 35.3 | % | 33.8 | % | 31.6 | % | |||||||||||
| Net income attributable to Artisan Partners Asset Management Inc. (GAAP) | $ | 290.3 | $ | 259.7 | $ | 222.3 | |||||||||||
Add back: Net income attributable to noncontrolling interests - Artisan Partners Holdings | 58.2 | 52.9 | 49.5 | ||||||||||||||
| Add back: Compensation expense (reversal) related to market valuation changes in compensation plans | 23.0 | 7.8 | 4.8 | ||||||||||||||
| Add back: Net (gain) loss on the tax receivable agreements | (0.6) | 0.5 | (0.5) | ||||||||||||||
| Add back: Net investment (gain) loss of investment products attributable to APAM | (58.0) | (31.9) | (38.4) | ||||||||||||||
| Add back: Interest expense | 8.6 | 8.6 | 8.6 | ||||||||||||||
| Add back: Provision for income taxes | 111.3 | 90.9 | 71.9 | ||||||||||||||
| Add back: Depreciation and amortization | 9.3 | 9.9 | 9.3 | ||||||||||||||
| Add back: Non-recurring expenses | — | 1.6 | — | ||||||||||||||
| Adjusted EBITDA (Non-GAAP) | $ | 442.1 | $ | 400.0 | $ | 327.5 | |||||||||||
53
Liquidity, Capital Resources and Contractual Obligations
Our working capital needs, including accrued incentive compensation payments, have been and are expected to be met primarily through cash generated by our operations. The assets and liabilities of consolidated investment products attributable to third-party investors do not impact our liquidity and capital resources. We have no right to the benefits from, nor do we bear the risks associated with, the assets and liabilities of consolidated investment products, beyond our direct equity investment and any investment advisory fees earned. Accordingly, assets and liabilities of consolidated investment products attributable to third-party investors are excluded from the amounts and discussions below. The following table shows our liquidity position as of December 31, 2025 and December 31, 2024:
| December 31, 2025 | December 31, 2024 | ||||||||||
| (in millions) | |||||||||||
| Cash and cash equivalents | $ | 214.4 | $ | 201.2 | |||||||
| Accounts receivable | 154.5 | 118.7 | |||||||||
Seed investments (1) | 151.6 | 154.9 | |||||||||
| Undrawn commitment on revolving credit facility | 100.0 | 100.0 | |||||||||
(1) Seed investments include Artisan's direct equity investments in consolidated and nonconsolidated investment products. The balance excludes $219.4 million and $150.4 million of investments made related to funded long-term incentive compensation plans as of December 31, 2025 and December 31, 2024, respectively. | |||||||||||
We manage our cash balances in order to fund our day-to-day operations. We mitigate concentration risk through the diversification of financial institutions holding daily operating cash balances and by investing excess operating cash in various money market funds. $166.5 million of our cash and cash equivalents balance was invested in money market funds as of December 31, 2025.
Accounts receivable primarily represent investment advisory fees that have been earned, but not yet received from our clients. We perform a review of our receivables on a monthly basis to assess collectability. As of December 31, 2025, none of our receivables were considered uncollectible.
We utilize cash to make seed investments in Artisan-sponsored investment products to support the development of new investment strategies and vehicles. As of December 31, 2025, the balance of all seed investments, including investments in consolidated investment products, was $151.6 million. The seed investments are generally redeemable at our discretion, subject to certain monthly or quarterly timing restrictions for certain Artisan Private Funds. We monitor for opportunities to redeem existing seed investments as sufficient scale in those strategies and vehicles is achieved.
During the year ended December 31, 2025, we made investments of $46.8 million related to funded long-term incentive compensation plans. As of December 31, 2025, the value of investments held in connection with funded long-term incentive compensations plans was $219.4 million. In the first quarter of 2026, we intend to invest an additional $50.6 million related to our economic hedge of franchise capital awards in connection with the grant that was approved by our Board on January 29, 2026.
In October 2023, we committed $16.0 million of capital as a seed investment in the Artisan Dislocation Opportunities Fund LP, a private fund that will call capital contributions and begin investment activity upon the occurrence of a market-based trigger. As of December 31, 2025, the trigger had not occurred and the capital had not yet been called, therefore the committed capital is not recorded in the Consolidated Statements of Financial Condition. The capital commitment terminates if the market trigger does not occur within three years of the October 30, 2023 initial closing date.
Under the terms of the Grandview Property Partners purchase agreement, we agreed to provide up to $50 million of seed capital commitments across Grandview’s next two flagship funds.
We expect our investment portfolio to continue to grow as we grant additional annual franchise capital awards and make additional seed capital investments in new strategies and vehicles to support our growth.
On August 15, 2025, Artisan Partners Holdings LP issued $50 million of 5.43% Series G Senior Notes and used the proceeds, along with cash on hand, to repay the $60 million of 4.29% Series D Senior Notes that matured on August 16, 2025. The Company incurred debt issuance costs of $0.5 million related to the notes which are amortized as interest expense over the life of the instrument.
As of December 31, 2025, we have $190 million in unsecured notes outstanding and a $100 million revolving credit facility with a five-year term ending in August 2027. The notes are comprised of three series, Series E, Series F and Series G, each with a balloon payment at maturity. The $100 million revolving credit facility was unused as of and for the year ended December 31, 2025.
The fixed interest rate on each series of unsecured notes is subject to a 100 basis point increase in the event Holdings receives a below-investment grade rating and any such increase will continue to apply until an investment grade rating is received. Holdings maintained an investment grade rating for the year ended December 31, 2025.
54
These borrowings contain certain customary covenants including limitations on Artisan Partners Holdings’ ability to: (i) incur additional indebtedness or liens, (ii) engage in mergers or other fundamental changes, (iii) sell or otherwise dispose of assets including equity interests and (iv) make dividend payments or other distributions to Artisan Partners Holdings’ partners (other than, among others, tax distributions paid to partners for the purpose of funding tax liabilities attributable to their interests) when a default occurred and is continuing or would result from such a distribution. In addition, in the event of a Change of Control (as defined in the Note Purchase Agreement) or if Artisan’s average AUM for a fiscal quarter is below $45 billion, Holdings is generally required to offer to pre-pay the notes. Artisan Partners Limited Partnership, a wholly-owned subsidiary of Holdings, has guaranteed Holdings’ obligations under the terms of the Note Purchase Agreement.
In addition, covenants in the note purchase and revolving credit agreements require Artisan Partners Holdings to maintain the following financial ratios:
•leverage ratio (calculated as the ratio of consolidated total indebtedness on any date to consolidated EBITDA for the period of four consecutive fiscal quarters ended on or prior to such date) cannot exceed 3.00 to 1.00 (Artisan Partners Holdings’ leverage ratio for the year ended December 31, 2025 was 0.4 to 1.00); and
•interest coverage ratio (calculated as the ratio of consolidated EBITDA for any period of four consecutive fiscal quarters to consolidated interest expense for such period) cannot be less than 4.00 to 1.00 for such period (Artisan Partners Holdings’ interest coverage ratio for the year ended December 31, 2025 was 60.3 to 1.00).
Our failure to comply with any of the covenants or restrictions described above could result in an event of default under the agreements, giving our lenders the ability to accelerate repayment of our obligations. We were in compliance with all debt covenants as of December 31, 2025.
As of December 31, 2025, we had approximately $151.0 million of future minimum rent commitments under non-cancellable leasing arrangements.
Distributions and Dividends
Artisan Partners Holdings’ distributions, including distributions to APAM, for the years ended December 31, 2025 and 2024 were as follows:
| For the Years Ended December 31, | |||||||||||
| 2025 | 2024 | ||||||||||
| (in millions) | |||||||||||
| Holdings Partnership Distributions to Limited Partners | $ | 56.2 | $ | 48.9 | |||||||
| Holdings Partnership Distributions to APAM | 363.1 | 305.9 | |||||||||
| Total Holdings Partnership Distributions | $ | 419.3 | $ | 354.8 | |||||||
APAM, acting as the general partner of Artisan Partners Holdings, declared, effective February 3, 2026, a distribution of $47.8 million, payable by Artisan Partners Holdings on February 20, 2026 to holders of its partnership units, including APAM.
APAM declared and paid the following dividends per share during the years ended December 31, 2025 and 2024:
| For the Years Ended December 31, | ||||||||||||||||||||
| Type of Dividend | Class of Stock | 2025 | 2024 | |||||||||||||||||
| Quarterly | Class A Common | $ | 3.13 | $ | 2.82 | |||||||||||||||
| Special Annual | Class A Common | $ | 0.50 | $ | 0.34 | |||||||||||||||
Our Board declared, effective February 3, 2026, a dividend of $1.58 per share of Class A common stock, consisting of a variable quarterly dividend of $1.01 per share of Class A common stock with respect to the December quarter of 2025 and a special annual dividend of $0.57 per share. The dividend will be paid on February 27, 2026 to stockholders of record as of the close of business on February 13, 2026. The variable quarterly dividend of $1.01 per share represents approximately 80% of the cash generated (as described below) in the December quarter of 2025. The special dividend represents the remainder of undistributed cash generated during the year ended December 31, 2025 in addition to other discrete sources and uses of cash throughout the year, including realized gains on seed capital redemptions and investments redeemed in connection with forfeited franchise capital awards, less cash reserved for future growth initiatives including acquisitions and seed investments in new investment strategies and vehicles.
Subject to Board approval each quarter, we currently expect to pay a quarterly dividend of approximately 80% of the cash the Company generates each quarter. We expect our quarterly cash generation to approximate adjusted net income plus long-term incentive compensation award expense, less cash reserved for future franchise capital awards, with additional adjustments made for certain other sources and uses of cash, including capital expenditures. After the end of the year, our Board will consider payment of a special dividend from the 20% withheld each quarter plus any discrete sources and uses of cash throughout the year,
55
which may include gains realized upon seed capital redemptions and investments redeemed in connection with forfeited franchise capital awards.
Although we expect to pay dividends according to our dividend policy, we may not pay dividends according to our policy or at all.
Tax Receivable Agreements (“TRAs”)
In addition to funding our normal operations, we will be required to fund amounts payable under the TRAs that we entered into in connection with the IPO, which resulted in the recognition of a $303.4 million liability as of December 31, 2025. The liability generally represents 85% of the tax benefits APAM expects to realize as a result of the merger of an entity into APAM as part of the IPO Reorganization, our purchase of partnership units from limited partners of Holdings and the exchange of partnership units (for shares of Class A common stock or other consideration).
The estimated liability assumes no material changes in the relevant tax law and that APAM earns sufficient taxable income to realize all tax benefits subject to the TRAs. An increase or decrease in future tax rates will increase or decrease, respectively, the expected tax benefits APAM would realize and the amounts payable under the TRAs. Changes in the estimate of expected tax benefits APAM would realize and the amounts payable under the TRAs as a result of change in tax rates have been and will be recorded in net income.
The liability will increase upon future purchases or exchanges of limited partnership units with the increase representing amounts payable under the TRAs equal to 85% of the estimated future tax benefits, if any, resulting from such purchases or exchanges. We intend to fund the payment of amounts due under the TRAs out of the reduced tax payments that APAM realizes in respect of the tax attributes to which the TRAs relate.
The actual increase in tax basis, as well as the amount and timing of any payments under these agreements, will vary depending upon a number of factors, including the timing of sales or exchanges by the holders of limited partnership units, the price of the Class A common stock at the time of such sales or exchanges, whether such sales or exchanges are taxable, the amount and timing of the taxable income APAM generates in the future and the tax rate then applicable and the portion of APAM’s payments under the TRAs constituting imputed interest or depreciable basis or amortizable basis.
In certain cases, payments under the TRAs may be accelerated and/or significantly exceed the actual benefits we realize in respect of the tax attributes subject to the TRAs. In such cases, we intend to fund those payments with cash on hand, although we may have to borrow funds depending on the amount and timing of the payments. During the year ended December 31, 2025, we made payments totaling $38.5 million, related to the TRAs, including interest. In 2026, we expect to make payments of approximately $40.4 million related to the TRAs.
Cash Flows
| For the Years Ended December 31, | |||||||||||||||||
| 2025 | 2024 | 2023 | |||||||||||||||
| (in millions) | |||||||||||||||||
| Cash and cash equivalents as of January 1, | $ | 268.2 | $ | 178.5 | $ | 143.3 | |||||||||||
| Net cash provided by operating activities | 172.0 | 372.8 | 253.1 | ||||||||||||||
| Net cash provided by (used in) investing activities | 35.3 | (24.9) | (38.2) | ||||||||||||||
| Net cash used in financing activities | (183.0) | (254.2) | (175.0) | ||||||||||||||
| Net impact of deconsolidation of consolidated investment products | (37.0) | (4.0) | (4.7) | ||||||||||||||
| Cash and cash equivalents as of December 31, | $ | 255.5 | $ | 268.2 | $ | 178.5 | |||||||||||
Year Ended December 31, 2025, Compared to Year Ended December 31, 2024
Net cash provided by operating activities decreased $200.8 million during the year ended December 31, 2025, compared to the year ended December 31, 2024. Net cash used in net purchase activity and other consolidated investment product activity increased by $213.8 million in 2025, driven primarily by a net increase in subscriptions to consolidated investment products. The increase included third-party subscriptions and additional capital provided by Artisan, including subscriptions related to two new consolidated investment products launched during the period. The increase in cash used by consolidated investment products was partially offset by a $33.0 million increase in operating income in the year ended December 31, 2025, as compared to the year ended December 31, 2024.
Investing activities consist of the purchase and sale of investment securities and the acquisition of property and equipment, and leasehold improvements. Net cash provided by (used in) investing activities increased $60.2 million during the year ended December 31, 2025, primarily due to seed redemptions and a decrease in capital expenditures.
Financing activities consist primarily of dividend payments to holders of our Class A common stock, partnership distributions to non-controlling interests, contributions to and distributions from consolidated investment products, payments of principal or proceeds received from our senior notes and payments owed under the tax receivable agreements. Net cash used in financing
56
activities decreased $71.2 million during the year ended December 31, 2025. Investment subscriptions received by consolidated investment products increased by $128.0 million, which was partially offset by a $42.5 million increase in dividend and distribution payments and a $10.0 million net decrease in notes payable.
The investment product that was deconsolidated during the year ended December 31, 2025, resulted in a $33.0 million greater decrease in cash and cash equivalents compared to the investment product that was deconsolidated during the year ended December 31, 2024.
Critical Accounting Policies and Estimates
The accompanying consolidated financial statements were prepared in accordance with GAAP, and related rules and regulations of the SEC. The preparation of financial statements in conformity with GAAP requires management to make estimates or assumptions that affect the reported amounts of assets and liabilities at the date of the financial statements and the reported amounts of revenues and expenses during the periods presented. Actual results could differ from these estimates or assumptions and may have a material effect on the consolidated financial statements.
Accounting policies are an integral part of our financial statements. A thorough understanding of these accounting policies is essential when reviewing our reported results of operations and our financial condition. Management believes that the critical accounting policies and estimates discussed below involve additional management judgment due to the sensitivity of the methods and assumptions used.
Consolidation
We consolidate all subsidiaries or other entities in which we have a controlling financial interest. We assess each legal entity in which we hold a variable interest on a quarterly basis to determine whether consolidation is appropriate. We determine whether we have a controlling financial interest in the entity by evaluating whether the entity is a voting interest entity (“VOE”) or a variable interest entity (“VIE”) under GAAP. Assessing whether an entity is a VIE or VOE and if it requires consolidation involves judgment and analysis. Factors considered in this assessment include the legal organization of the entity, our equity ownership and contractual involvement with the entity and any related party or de facto agent implications of our involvement with the entity.
Voting Interest Entities - A VOE is an entity in which (i) the total equity investment at risk is sufficient to enable the entity to finance its activities independently and (ii) the equity holders at risk have the obligation to absorb losses, the right to receive residual returns and the right to direct the activities of the entity that most significantly impact the entity’s economic performance, whereby the equity investment has all the characteristics of a controlling financial interest. As a result, voting rights are a key driver of determining which party, if any, should consolidate the entity. Under the VOE model, controlling financial interest is generally defined as a majority ownership of voting interests.
Variable Interest Entities - A VIE is an entity that lacks one or more of the characteristics of a VOE. In accordance with GAAP, an enterprise must consolidate all VIEs of which it is the primary beneficiary. We determine if a legal entity meets the definition of a VIE by considering whether the fund’s equity investment at risk is sufficient to finance its activities without additional subordinated financial support and whether the fund’s at-risk equity holders absorb any losses, have the right to receive residual returns and have the right to direct the activities of the entity most responsible for the entity’s economic performance.
Under the VIE model, controlling financial interest is defined as (i) the power to direct activities that most significantly impact the economic performance of the entity and (ii) the right to receive potentially significant benefits or the obligation to absorb potentially significant losses. We will generally consolidate VIEs in which we meet the power criteria and hold an equity ownership interest of greater than 10%.
We serve as the investment adviser for Artisan Funds, a family of mutual funds registered with the SEC under the Investment Company Act of 1940, and investment manager of Artisan Global Funds, a family of Ireland-based UCITS funds. Artisan Funds and Artisan Global Funds are corporate entities the business and affairs of which are managed by their respective boards of directors. The shareholders of the funds retain voting rights, including the right to elect and reelect members of their respective boards of directors. Each series of Artisan Funds is a VOE and is separately evaluated for consolidation under the VOE model. The shareholders of Artisan Global Funds lack simple majority liquidation rights, and as a result, Artisan Global Funds is evaluated for consolidation under the VIE model. Artisan Private Funds are also evaluated for consolidation under the VIE model because third-party equity holders of the funds lack the ability to remove Artisan as the general partner, or otherwise divest Artisan of its control of the funds.
Seed Investments - We generally make seed investments in sponsored investment portfolios at the portfolio’s formation. If the seed investment results in a controlling financial interest, we will consolidate the investment, and the underlying individual securities will be accounted for based on their classification at the underlying fund. If the seed investment results in significant influence, but not control, the investment will be accounted for as an equity method investment. Significant influence is generally considered to exist with equity ownership levels between 20% and 50%, although other factors are considered. Seed investments in which we do not have a controlling financial interest or significant influence are accounted for as investment securities. These investments are measured at fair value in the Consolidated Statements of Financial Condition. Realized and unrealized gains (losses) on investment securities are recorded in net investment income in the Consolidated Statements of Operations. Dividend
57
income from these investments is recognized when earned and is included in net investment income in the Consolidated Statements of Operations.
Revenue Recognition
Investment management fees are generally computed as a percentage of AUM and are recognized as revenue at the end of each distinct service period. Fees for providing investment management services are computed and billed in accordance with the underlying investment management agreements, which is generally on a monthly or quarterly basis. Investment management fees are presented net of cash rebates to certain Artisan Global Fund investors and expense reimbursements pursuant to contractual expense limitations of pooled investment vehicles.
A number of investment management agreements provide for performance-based fees or incentive allocations, collectively “performance fees”. Performance fees, if earned, are recognized upon completion of the contractually determined measurement period, which is generally quarterly or annually. Performance fees recognized within the Consolidated Statements of Operations are not subject to claw back as a result of performance declines subsequent to the most recent measurement date.
Artisan accounts for asset management services as a single performance obligation that is satisfied over time, using a time-based measure of progress to recognize revenue. Customer consideration is variable due to the uncertainty of the value of AUM during each distinct service period. At the end of each quarter, Artisan records revenue for the actual amount of investment management fees for that quarter because the uncertainty has been resolved.
Performance fees are subject to the uncertainty of market volatility, and as a result, the entire amount of the variable consideration related to performance fees is constrained until the end of each measurement period. At the end of the quarterly or annual measurement period, revenue is recorded for the actual amount of performance fees earned during that period because the uncertainty has been resolved.
The portfolios of Artisan Funds and Artisan Global Funds, as well as the portfolios we manage for our other clients, are invested principally in securities for which market values are readily available, with a portion of each portfolio held in cash or cash-like instruments. With the exception of the assets managed by our Credit team and EMsights Capital Group (which together represented approximately 10.0% of our AUM at December 31, 2025), the portfolios are invested principally in publicly-traded equity securities.
The investment management fees that we receive are calculated based on the values of the securities held in the accounts that we manage for our clients. For our U.S.-registered mutual fund and UCITS fund clients, including Artisan Funds and Artisan Global Funds, and for Artisan Private Funds, our fees are based on the values of the funds’ assets as determined for purposes of calculating their net asset values. Securities held by Artisan Funds, Artisan Global Funds and Artisan Private Funds are generally valued at closing market prices, or if closing market prices are not readily available or are not considered reliable, at a fair value determined under procedures established by the fund’s board (fair value pricing). Values of securities determined using fair value pricing are likely to be different than they would be if only closing market prices were used.
For separate account clients, our fees may be based, at the client’s option, on the values of the securities in the portfolios we manage as determined by the client (or its custodian or other service provider) or by us in accordance with valuation procedures we have adopted. The valuation procedures we have adopted generally use closing market prices in the markets in which the securities trade, without adjustment for subsequent events except in unusual circumstances. We believe that our fees based on valuations determined under our procedures are not materially different from the fees we receive that are based on valuations determined by clients, their custodians or other service providers.
Income Taxes
We operate in numerous states and countries and must allocate our income, expenses and earnings under the various laws and regulations of each of these taxing jurisdictions. Accordingly, our provision for income taxes represents our total estimate of the liability for income taxes that we have incurred in doing business each year in all of our locations. Annually, we file tax returns that represent our filing positions with each jurisdiction and settle our tax return liabilities. Each jurisdiction has the right to audit those tax returns and may take different positions with respect to income and expense allocations and taxable earnings determinations. Because the determination of our annual income tax provision is subject to judgments and estimates, actual results may vary from those recorded in our financial statements. We recognize additions to and reductions in income tax expense during a reporting period that pertains to prior period provisions as our estimated liabilities are revised and our actual tax returns and tax audits are completed.
Our management is required to exercise judgment in developing our provision for income taxes, including the determination of deferred tax assets and liabilities and any valuation allowance that might be required against deferred tax assets. As of December 31, 2025, we have not recorded a valuation allowance on any deferred tax assets. In the event that sufficient taxable income of the same character does not result in future years, among other things, a valuation allowance for certain of our deferred tax assets may be required.
58
Payments pursuant to the Tax Receivable Agreements (“TRAs”)
We have recorded a liability of $303.4 million as of December 31, 2025, representing 85% of the estimated future tax benefits subject to the TRAs. The actual amount and timing of any payments under these agreements will vary depending upon a number of factors, including the timing of sales or exchanges by the holders of limited partnership units, the price of the Class A common stock at the time of such sales or exchanges, whether such sales or exchanges are taxable, the amount and timing of the taxable income APAM generates in the future and the tax rate then applicable and the portion of APAM’s payments under the TRAs constituting imputed interest or depreciable basis or amortizable basis.
New or Revised Accounting Standards
See Note 2, “Summary of Significant Accounting Policies — Recent accounting pronouncements” to the Consolidated Financial Statements included in Item 8 of Part II of this Form 10-K.
Item 7A. Qualitative and Quantitative Disclosures Regarding Market Risk
Market Risk
Our exposure to market risk is directly related to the role of our operating company as an investment adviser for the pooled vehicles and separate accounts it manages. Essentially all of our revenues are derived from investment management agreements with these vehicles and accounts. Under these agreements, the investment advisory fees we receive are generally based on the value of our AUM, our fee rates and, for the accounts on which we earn performance based fees, the investment performance of those accounts. Accordingly, if our AUM decline as a result of market depreciation, our revenues and net income will also decline. In addition, such a decline could cause our clients to withdraw their funds in favor of investments believed to offer higher returns or lower risk, which would cause our revenues to decline further.
The value of our AUM was $179.9 billion as of December 31, 2025. A 10% increase or decrease in the value of our AUM, if proportionately distributed over all our investment strategies, products and client relationships, would cause an annualized increase or decrease in our revenues of approximately $124.7 million at our current weighted average fee rate of 69 basis points. Because of our declining rates of fee for larger relationships and differences in our rates of fee across investment strategies, a change in the composition of our AUM, in particular an increase in the proportion of our total AUM attributable to strategies, clients or relationships with lower effective rates of fees, could have a material negative impact on our overall weighted average rate of fee. The same 10% increase or decrease in the value of our total AUM, if attributed entirely to a proportionate increase or decrease in the assets of each of the Artisan Funds and Artisan Global Funds, to which we provide a range of services in addition to those provided to separate accounts and therefore charge a higher rate of fee, would cause an annualized increase or decrease in our revenues of approximately $158.9 million at the Artisan Funds and Artisan Global Funds aggregate weighted average fee of 88 basis points. If the same 10% increase or decrease in the value of our total AUM was attributable entirely to a proportionate increase or decrease in the assets of each separate account we manage, it would cause an annualized increase or decrease in our revenues of approximately $86.7 million at the current weighted average fee rate across all of our separate accounts of 48 basis points.
As is customary in the asset management industry, clients invest in particular strategies to gain exposure to certain asset classes, which exposes their investment to the benefits and risks of those asset classes. Because we believe that our clients invest in each of our strategies in order to gain exposure to the portfolio securities of the respective strategies and may implement their own risk management program or procedures, we have not adopted a corporate-level risk management policy regarding client assets, nor have we attempted to hedge at the corporate level or within individual strategies the market risks that would affect the value of our overall AUM and related revenues. Some of these risks (e.g., sector risks and currency risks) are inherent in certain strategies, and clients may invest in particular strategies to gain exposure to particular risks. While negative returns in our investment strategies and net client cash outflows do not directly reduce the assets on our balance sheet (because the assets we manage are owned by our clients, not us), any reduction in the value of our AUM would result in a reduction in our revenues.
We are subject to market risk from a decline in the prices of marketable securities that we own. The total value of marketable securities we owned, including our direct equity investments in consolidated investment products, was $371.0 million as of December 31, 2025. We invested in certain Artisan Private Funds, Artisan Funds and Artisan Global Funds in amounts sufficient to cover certain organizational expenses and to ensure that the funds had sufficient assets at the commencement of their operations to build a viable investment portfolio. In addition, we invested in Artisan investment strategies to hedge our economic exposure to the change in value of our franchise capital awards due to market movements. Assuming a 10% increase or decrease in the values of our total marketable securities, the fair value would increase or decrease by $37.1 million at December 31, 2025. Management regularly monitors the value of these investments; however, given their nature and relative size, we have not adopted a specific risk management policy to manage the associated market risk.
59
Exchange Rate Risk
A substantial portion of the accounts that we advise, or sub-advise, hold investments that are denominated in currencies other than the U.S. dollar. Movements in the rate of exchange between the U.S. dollar and the underlying foreign currency affect the values of assets held in accounts we manage, thereby affecting the amount of revenues we earn. The value of the assets we manage was $179.9 billion as of December 31, 2025. As of December 31, 2025, approximately 48% of our AUM were invested in strategies that primarily invest in securities of non-U.S. companies and approximately 50% of our AUM were invested in securities denominated in currencies other than the U.S. dollar. To the extent our AUM are denominated in currencies other than the U.S. dollar, the value of those AUM will decrease with an increase in the value of the U.S. dollar, or increase with a decrease in the value of the U.S. dollar. Each investment team monitors its own exposure to exchange rate risk and makes decisions on how to manage that risk in the portfolios managed by that team.
We have not adopted a corporate-level risk management policy to manage exchange rate risk in the assets we manage. Assuming that 50% of our AUM is invested in securities denominated in currencies other than the U.S. dollar and excluding the impact of any hedging arrangements, a 10% increase or decrease in the value of the U.S. dollar would decrease or increase the fair value of our AUM by $9.0 billion, which would cause an annualized increase or decrease in revenues of approximately $62.3 million at our current weighted average fee rate of 69 basis points.
We operate in several foreign countries of which the United Kingdom is the most prominent. We incur operating expenses and have foreign currency-denominated assets and liabilities associated with these operations. In addition, we have revenue arrangements that are denominated in non-U.S. currencies. We do not believe these revenue arrangements denominated in foreign currencies or our operations in foreign countries create foreign currency fluctuations that materially affect our results of operations.
Interest Rate Risk
We generally invest our available cash balances in money market mutual funds that invest primarily in U.S. Treasury or agency-backed money market instruments. These funds attempt to maintain a stable net asset value but interest rate changes or other market risks may affect the fair value of those funds’ investments and, if significant, could result in a loss of investment principal. Interest rate changes affect the income we earn from our excess cash balances. As of December 31, 2025, $166.5 million of our available cash was invested in money market funds that invested solely in U.S. Treasuries. Interest rate changes would not have a material impact on the income we earn from these investments. The remaining portion of our cash was held in demand deposit accounts.
Interest rate changes may affect the amount of our interest payments in connection with our revolving credit agreement, and thereby affect future earnings and cash flows. As of December 31, 2025, there were no borrowings outstanding under the revolving credit agreement.
The credit strategies managed by our Credit team and EMsights Capital Group, which had $19.4 billion of AUM as of December 31, 2025, invest in fixed income securities. The values of debt instruments held by these strategies may fall in response to increases in interest rates, which would reduce our revenues. We have considered the potential impact of a 100 basis point movement in market interest rates on the portfolios of the strategies managed by these teams. Based on our analysis, we do not expect that such a change would have a material impact on our revenues or results of operations in the next twelve months.
60
Item 8. Financial Information and Supplementary Data
| Index to Financial Statements: | Page | ||||
Report of Independent Registered Public Accounting Firm (PCAOB ID | |||||
Consolidated Statements of Financial Condition as of December 31, 2025 and 2024 | |||||
Consolidated Statements of Operations for the years ended December 31, 2025, 2024 and 2023 | |||||
Consolidated Statements of Comprehensive Income for the years ended December 31, 2025, 2024 and 2023 | |||||
Consolidated Statements of Changes in Stockholders’ Equity for the years ended December 31, 2025, 2024 and 2023 | |||||
Consolidated Statements of Cash Flows for the years ended December 31, 2025, 2024 and 2023 | |||||
Notes to Consolidated Financial Statements as of and for the years ended December 31, 2025, 2024 and 2023 | |||||
61
Report of Independent Registered Public Accounting Firm
To the Board of Directors and Stockholders of Artisan Partners Asset Management Inc.:
Opinions on the Financial Statements and Internal Control over Financial Reporting
We have audited the accompanying consolidated statements of financial condition of Artisan Partners Asset Management Inc. and its subsidiaries (the “Company”) as of December 31, 2025 and 2024, and the related consolidated statements of operations, of comprehensive income, of changes in stockholders’ equity and of cash flows for each of the three years in the period ended December 31, 2025, including the related notes (collectively referred to as the “consolidated financial statements”). We also have audited the Company's internal control over financial reporting as of December 31, 2025, based on criteria established in Internal Control - Integrated Framework (2013) issued by the Committee of Sponsoring Organizations of the Treadway Commission (COSO).
In our opinion, the consolidated financial statements referred to above present fairly, in all material respects, the financial position of the Company as of December 31, 2025 and 2024, and the results of its operations and its cash flows for each of the three years in the period ended December 31, 2025 in conformity with accounting principles generally accepted in the United States of America. Also in our opinion, the Company maintained, in all material respects, effective internal control over financial reporting as of December 31, 2025, based on criteria established in Internal Control - Integrated Framework (2013) issued by the COSO.
Basis for Opinions
The Company's management is responsible for these consolidated financial statements, for maintaining effective internal control over financial reporting, and for its assessment of the effectiveness of internal control over financial reporting, included in the Report of Management on Internal Control over Financial Reporting appearing under Item 9A. Our responsibility is to express opinions on the Company’s consolidated financial statements and on the Company's internal control over financial reporting based on our audits. We are a public accounting firm registered with the Public Company Accounting Oversight Board (United States) (PCAOB) and are required to be independent with respect to the Company in accordance with the U.S. federal securities laws and the applicable rules and regulations of the Securities and Exchange Commission and the PCAOB.
We conducted our audits in accordance with the standards of the PCAOB. Those standards require that we plan and perform the audits to obtain reasonable assurance about whether the consolidated financial statements are free of material misstatement, whether due to error or fraud, and whether effective internal control over financial reporting was maintained in all material respects.
Our audits of the consolidated financial statements included performing procedures to assess the risks of material misstatement of the consolidated financial statements, whether due to error or fraud, and performing procedures that respond to those risks. Such procedures included examining, on a test basis, evidence regarding the amounts and disclosures in the consolidated financial statements. Our audits also included evaluating the accounting principles used and significant estimates made by management, as well as evaluating the overall presentation of the consolidated financial statements. Our audit of internal control over financial reporting included obtaining an understanding of internal control over financial reporting, assessing the risk that a material weakness exists, and testing and evaluating the design and operating effectiveness of internal control based on the assessed risk. Our audits also included performing such other procedures as we considered necessary in the circumstances. We believe that our audits provide a reasonable basis for our opinions.
Definition and Limitations of Internal Control over Financial Reporting
A company’s internal control over financial reporting is a process designed to provide reasonable assurance regarding the reliability of financial reporting and the preparation of financial statements for external purposes in accordance with generally accepted accounting principles. A company’s internal control over financial reporting includes those policies and procedures that (i) pertain to the maintenance of records that, in reasonable detail, accurately and fairly reflect the transactions and dispositions of the assets of the company; (ii) provide reasonable assurance that transactions are recorded as necessary to permit preparation of financial statements in accordance with generally accepted accounting principles, and that receipts and expenditures of the company are being made only in accordance with authorizations of management and directors of the company; and (iii) provide reasonable assurance regarding prevention or timely detection of unauthorized acquisition, use or disposition of the company’s assets that could have a material effect on the financial statements.
62
Because of its inherent limitations, internal control over financial reporting may not prevent or detect misstatements. Also, projections of any evaluation of effectiveness to future periods are subject to the risk that controls may become inadequate because of changes in conditions, or that the degree of compliance with the policies or procedures may deteriorate.
Critical Audit Matters
The critical audit matter communicated below is a matter arising from the current period audit of the consolidated financial statements that was communicated or required to be communicated to the audit committee and that (i) relates to accounts or disclosures that are material to the consolidated financial statements and (ii) involved our especially challenging, subjective or complex judgments. The communication of critical audit matters does not alter in any way our opinion on the consolidated financial statements, taken as a whole, and we are not, by communicating the critical audit matter below, providing a separate opinion on the critical audit matter or on the accounts or disclosures to which it relates.
Income Taxes – Deferred Tax Assets and Amounts Payable Under Tax Receivable Agreements
As described in Notes 2 and 11 to the consolidated financial statements, the Company has recorded a deferred tax assets (“DTA”) balance of $354.7 million at December 31, 2025 while the amount payable under the tax receivable agreements (“TRA”) was $303.4 million. DTAs are determined by management based upon the future tax consequences attributable to temporary differences between the financial statement carrying amounts and tax bases of assets. The TRAs generally provide for payment of 85% of the applicable cash savings, if any, of U.S. federal, state and local income taxes that the Company actually realizes (or is deemed to realize in certain circumstances) as a result of certain tax attributes or benefits. The cash savings are calculated by comparing the Company’s actual income tax liability to the amount it would have been required to pay had it not been able to utilize any of the tax benefits subject to the TRAs. The increase in tax basis, which results in a DTA, as well as the amount and timing of any payments under these agreements, will vary depending on a number of factors, which include the timing of sales or exchanges by the holders of limited partnership units, the price of the Class A common stock at the time of such sales or exchanges, whether such sales or exchanges are taxable, the amount and timing of the taxable income the Company generates in the future and the tax rate then applicable, and the portion of the Company’s payments under the TRAs constituting imputed interest or depreciable basis or amortizable basis.
The principal considerations for our determination that performing procedures relating to deferred tax assets and amounts payable under tax receivable agreements is a critical audit matter are (1) the significant audit effort necessary in performing procedures related to the aforementioned factors utilized in the estimate and the assessment of the application of the tax laws, and (2) the use of professionals with specialized skill and knowledge to assist in evaluating the audit evidence obtained from these procedures.
Addressing the matter involved performing procedures and evaluating audit evidence in connection with forming our overall opinion on the consolidated financial statements. These procedures included testing the effectiveness of controls relating to income taxes, including controls over the deferred tax assets and tax receivable agreements. These procedures also included, among others, testing management’s process for estimating the deferred tax assets and amounts payable under tax receivable agreements, including (1) testing the factors to the Company’s estimates, related to the timing of sales or exchanges by the holders of limited partnership units and the price of the Class A common stock at the time of such sales or exchanges, (2) assessing the reasonableness of the factors used in the Company’s estimates, related to the likelihood of the Company having sufficient future taxable income to utilize the deferred tax asset as well as the portion of the Company’s payments under the TRA constituting depreciable basis or amortizable basis, and (3) testing the impact of sales or exchanges of limited partnership units on the deferred tax asset and amounts payable under tax receivable agreements. Professionals with specialized skill and knowledge were used to assist in testing the estimates and assessing the appropriateness of the application of the tax laws related to evaluating whether the sales or exchanges of partnership units are taxable.
/s/ PricewaterhouseCoopers LLP
February 20, 2026
We have served as the Company’s auditor since 1995.
63
ARTISAN PARTNERS ASSET MANAGEMENT INC.
Consolidated Statements of Financial Condition
(U.S. dollars in thousands, except per share amounts)
| At December 31, | |||||||||||
| 2025 | 2024 | ||||||||||
| ASSETS | |||||||||||
| Cash and cash equivalents | $ | $ | |||||||||
| Accounts receivable | |||||||||||
| Investment securities | |||||||||||
| Prepaid expenses | |||||||||||
| Property and equipment, net | |||||||||||
| Operating lease assets | |||||||||||
| Deferred tax assets | |||||||||||
| Other | |||||||||||
| Assets of consolidated investment products | |||||||||||
Cash and cash equivalents | |||||||||||
Accounts receivable and other | |||||||||||
Investment assets, at fair value | |||||||||||
| Total assets | $ | $ | |||||||||
| LIABILITIES, REDEEMABLE NONCONTROLLING INTERESTS AND STOCKHOLDERS’ EQUITY | |||||||||||
| Accounts payable, accrued expenses and other | $ | $ | |||||||||
| Accrued short-term incentive compensation | |||||||||||
| Accrued long-term incentive compensation | |||||||||||
| Operating lease liabilities | |||||||||||
| Borrowings | |||||||||||
| Amounts payable under tax receivable agreements | |||||||||||
| Liabilities of consolidated investment products | |||||||||||
Accounts payable, accrued expenses and other | |||||||||||
Investment liabilities, at fair value | |||||||||||
| Total liabilities | $ | $ | |||||||||
| Commitments and contingencies | |||||||||||
| Redeemable noncontrolling interests | |||||||||||
| Common stock | |||||||||||
Class A common stock ($ | |||||||||||
Class B common stock ($ | |||||||||||
Class C common stock ($ | |||||||||||
| Additional paid-in capital | |||||||||||
| Retained earnings | |||||||||||
| Accumulated other comprehensive income (loss) | ( | ( | |||||||||
| Total Artisan Partners Asset Management Inc. stockholders’ equity | |||||||||||
| Noncontrolling interests - Artisan Partners Holdings | |||||||||||
| Total stockholders’ equity | $ | $ | |||||||||
| Total liabilities, redeemable noncontrolling interests and stockholders’ equity | $ | $ | |||||||||
The accompanying notes are an integral part of the consolidated financial statements.
64
ARTISAN PARTNERS ASSET MANAGEMENT INC.
Consolidated Statements of Operations
(U.S. dollars in thousands, except per share amounts)
| For the Years Ended December 31, | |||||||||||||||||
| 2025 | 2024 | 2023 | |||||||||||||||
| Revenues | |||||||||||||||||
| Management fees | $ | $ | $ | ||||||||||||||
| Performance fees | |||||||||||||||||
| Total revenues | $ | $ | $ | ||||||||||||||
| Operating Expenses | |||||||||||||||||
| Compensation and benefits | |||||||||||||||||
| Distribution, servicing and marketing | |||||||||||||||||
| Occupancy | |||||||||||||||||
| Communication and technology | |||||||||||||||||
| General and administrative | |||||||||||||||||
| Total operating expenses | |||||||||||||||||
| Total operating income | |||||||||||||||||
| Non-operating income (expense) | |||||||||||||||||
| Interest expense | ( | ( | ( | ||||||||||||||
| Interest income on cash and cash equivalents and other | |||||||||||||||||
| Net gain (loss) on the tax receivable agreements | ( | ||||||||||||||||
| Net investment gain (loss) of consolidated investment products | |||||||||||||||||
| Net investment gain (loss) of nonconsolidated investment products | |||||||||||||||||
| Total non-operating income (expense) | |||||||||||||||||
| Income before income taxes | |||||||||||||||||
| Provision for income taxes | |||||||||||||||||
| Net income before noncontrolling interests | |||||||||||||||||
| Less: Net income attributable to noncontrolling interests - Artisan Partners Holdings | |||||||||||||||||
| Less: Net income (loss) attributable to noncontrolling interests - consolidated investment products | |||||||||||||||||
| Net income attributable to Artisan Partners Asset Management Inc. | $ | $ | $ | ||||||||||||||
| Basic earnings per share | $ | $ | $ | ||||||||||||||
| Diluted earnings per share | $ | $ | $ | ||||||||||||||
| Basic weighted average number of common shares outstanding | |||||||||||||||||
| Diluted weighted average number of common shares outstanding | |||||||||||||||||
| Dividends declared per Class A common share | $ | $ | $ | ||||||||||||||
The accompanying notes are an integral part of the consolidated financial statements.
65
ARTISAN PARTNERS ASSET MANAGEMENT INC.
Consolidated Statements of Comprehensive Income
(U.S. dollars in thousands)
| For the Years Ended December 31, | |||||||||||||||||
| 2025 | 2024 | 2023 | |||||||||||||||
| Net income before noncontrolling interests | $ | $ | $ | ||||||||||||||
| Other comprehensive income (loss) | |||||||||||||||||
| Foreign currency translation gain (loss) | ( | ||||||||||||||||
| Total other comprehensive income (loss) | ( | ||||||||||||||||
| Comprehensive income | |||||||||||||||||
| Comprehensive income attributable to noncontrolling interests - Artisan Partners Holdings | |||||||||||||||||
| Comprehensive income attributable to noncontrolling interests - consolidated investment products | |||||||||||||||||
| Comprehensive income attributable to Artisan Partners Asset Management Inc. | $ | $ | $ | ||||||||||||||
The accompanying notes are an integral part of the consolidated financial statements.
66
ARTISAN PARTNERS ASSET MANAGEMENT INC.
Consolidated Statements of Changes in Stockholders’ Equity
(U.S. dollars in thousands)
| Class A Common Stock | Class B Common Stock | Class C Common Stock | Additional Paid-in Capital | Retained Earnings | Accumulated Other Comprehensive Income (Loss) | Noncontrolling Interests - Artisan Partners Holdings | Total Stockholders’ Equity | Redeemable Noncontrolling Interests | |||||||||||||||||||||
Balance at January 1, 2023 | $ | $ | $ | $ | $ | $ | ( | $ | $ | $ | |||||||||||||||||||
| Net income | — | — | — | — | — | ||||||||||||||||||||||||
| Other comprehensive income - foreign currency translation | — | — | — | — | — | — | |||||||||||||||||||||||
| Cumulative impact of changes in ownership of Artisan Partners Holdings LP | — | — | — | ( | — | ( | — | ||||||||||||||||||||||
| Amortization of equity-based compensation | — | — | — | — | — | — | |||||||||||||||||||||||
| Deferred tax assets, net of amounts payable under tax receivable agreements | — | — | — | — | — | — | — | ||||||||||||||||||||||
| Issuance of Class A common stock, net of issuance costs | — | — | ( | — | — | — | ( | — | |||||||||||||||||||||
| Forfeitures and employee/partner terminations | ( | — | — | — | — | ||||||||||||||||||||||||
| Issuance of restricted stock awards | — | — | ( | — | — | — | — | ||||||||||||||||||||||
| Employee net share settlement | ( | — | — | ( | — | ( | ( | — | |||||||||||||||||||||
| Exchange of subsidiary equity | ( | — | — | — | — | — | |||||||||||||||||||||||
| Capital contributions, net | — | — | — | — | — | — | — | — | |||||||||||||||||||||
| Impact of deconsolidation of consolidated investment products | — | — | — | — | — | — | — | — | ( | ||||||||||||||||||||
| Distributions | — | — | — | — | — | — | ( | ( | — | ||||||||||||||||||||
| Dividends | — | — | — | ( | — | ( | ( | — | |||||||||||||||||||||
Balance at December 31, 2023 | $ | $ | $ | $ | $ | $ | ( | $ | $ | $ | |||||||||||||||||||
| Net income | — | — | — | — | — | ||||||||||||||||||||||||
| Other comprehensive income (loss) - foreign currency translation | — | — | — | — | — | ( | ( | ( | — | ||||||||||||||||||||
| Cumulative impact of changes in ownership of Artisan Partners Holdings LP | — | — | — | — | ( | ( | — | ||||||||||||||||||||||
| Amortization of equity-based compensation | — | — | — | — | — | — | |||||||||||||||||||||||
| Deferred tax assets, net of amounts payable under tax receivable agreements | — | — | — | — | — | — | — | ||||||||||||||||||||||
| Issuance of Class A common stock, net of issuance costs | — | — | ( | — | — | — | — | ||||||||||||||||||||||
| Employee net share settlement | ( | — | — | ( | — | ( | ( | — | |||||||||||||||||||||
| Exchange of subsidiary equity | ( | ( | — | — | — | — | — | ||||||||||||||||||||||
| Capital contributions, net | — | — | — | — | — | — | — | — | |||||||||||||||||||||
| Impact of deconsolidation of consolidated investment products | — | — | — | — | — | — | — | — | ( | ||||||||||||||||||||
| Distributions | — | — | — | — | — | — | ( | ( | — | ||||||||||||||||||||
| Dividends | — | — | — | ( | — | ( | ( | — | |||||||||||||||||||||
Balance at December 31, 2024 | $ | $ | $ | $ | $ | $ | ( | $ | $ | $ | |||||||||||||||||||
The accompanying notes are an integral part of the consolidated financial statements.
67
ARTISAN PARTNERS ASSET MANAGEMENT INC.
Consolidated Statements of Changes in Stockholders’ Equity, continued
(U.S. dollars in thousands)
| Class A Common Stock | Class B Common Stock | Class C Common Stock | Additional Paid-in Capital | Retained Earnings | Accumulated Other Comprehensive Income (Loss) | Noncontrolling Interests - Artisan Partners Holdings | Total Stockholders’ Equity | Redeemable Noncontrolling Interests | |||||||||||||||||||||
Balance at January 1, 2025 | $ | $ | $ | $ | $ | $ | ( | $ | $ | $ | |||||||||||||||||||
| Net income | — | — | — | — | — | ||||||||||||||||||||||||
| Other comprehensive income (loss) - foreign currency translation | — | — | — | — | — | — | |||||||||||||||||||||||
| Cumulative impact of changes in ownership of Artisan Partners Holdings LP | — | — | — | ( | — | ( | — | ||||||||||||||||||||||
| Amortization of equity-based compensation | — | — | — | — | — | ||||||||||||||||||||||||
| Deferred tax assets, net of amounts payable under tax receivable agreements | — | — | — | — | — | — | — | ||||||||||||||||||||||
| Issuance of restricted stock awards | — | — | ( | — | — | — | — | ||||||||||||||||||||||
| Employee net share settlement | ( | — | — | ( | — | ( | ( | — | |||||||||||||||||||||
| Exchange of subsidiary equity | ( | — | — | — | — | — | |||||||||||||||||||||||
| Capital contributions, net | — | — | — | — | — | — | — | — | |||||||||||||||||||||
| Impact of deconsolidation of consolidated investment products | — | — | — | — | — | — | — | — | ( | ||||||||||||||||||||
| Distributions | — | — | — | — | — | — | ( | ( | — | ||||||||||||||||||||
| Dividends | — | — | — | ( | — | ( | ( | — | |||||||||||||||||||||
Balance at December 31, 2025 | $ | $ | $ | $ | $ | $ | ( | $ | $ | $ | |||||||||||||||||||
The accompanying notes are an integral part of the consolidated financial statements.
68
ARTISAN PARTNERS ASSET MANAGEMENT INC.
Consolidated Statements of Cash Flows
(U.S. dollars in thousands)
| For the Years Ended December 31, | |||||||||||||||||
| Cash flows from operating activities | 2025 | 2024 | 2023 | ||||||||||||||
| Net income before noncontrolling interests | $ | $ | $ | ||||||||||||||
| Adjustments to reconcile net income to net cash provided by operating activities: | |||||||||||||||||
| Depreciation and amortization | |||||||||||||||||
| Deferred income taxes | |||||||||||||||||
| Asset impairment | |||||||||||||||||
| Noncash lease expense | ( | ( | ( | ||||||||||||||
| Net investment (gain) loss on nonconsolidated investment securities | ( | ( | ( | ||||||||||||||
| Net (gain) loss on the tax receivable agreements | ( | ( | |||||||||||||||
| Loss on disposal of property and equipment | |||||||||||||||||
| Amortization of debt issuance costs | |||||||||||||||||
| Share-based compensation | |||||||||||||||||
| Net investment (gain) loss of consolidated investment products | ( | ( | ( | ||||||||||||||
| Purchase of investments by consolidated investment products | ( | ( | ( | ||||||||||||||
| Proceeds from sale of investments by consolidated investment products | |||||||||||||||||
| Net change in operating assets and liabilities of consolidated investment products including net investment income | |||||||||||||||||
| Change in assets and liabilities resulting in an increase (decrease) in cash: | |||||||||||||||||
| Accounts receivable | ( | ( | |||||||||||||||
| Prepaid expenses and other assets | ( | ( | |||||||||||||||
| Accounts payable and accrued expenses | |||||||||||||||||
| Net cash provided by operating activities | |||||||||||||||||
| Cash flows from investing activities | |||||||||||||||||
| Acquisition of property and equipment | ( | ( | ( | ||||||||||||||
| Leasehold improvements | ( | ( | ( | ||||||||||||||
| Proceeds from sale of investment securities | |||||||||||||||||
| Purchase of investment securities | ( | ( | ( | ||||||||||||||
| Net cash provided by (used in) investing activities | ( | ( | |||||||||||||||
The accompanying notes are an integral part of the consolidated financial statements.
69
ARTISAN PARTNERS ASSET MANAGEMENT INC.
Consolidated Statements of Cash Flows (continued)
(U.S. dollars in thousands)
| For the Years Ended December 31, | |||||||||||||||||
| Cash flows from financing activities | 2025 | 2024 | 2023 | ||||||||||||||
| Partnership distributions | ( | ( | ( | ||||||||||||||
| Dividends paid | ( | ( | ( | ||||||||||||||
| Payment of debt issuance costs | ( | ||||||||||||||||
| Proceeds from issuance of notes payable | |||||||||||||||||
| Principal payments on notes payable | ( | ||||||||||||||||
| Payments under the tax receivable agreements | ( | ( | ( | ||||||||||||||
| Taxes paid related to employee net share settlement | ( | ( | ( | ||||||||||||||
| Capital contributions to consolidated investment products, net | |||||||||||||||||
| Net cash used in financing activities | ( | ( | ( | ||||||||||||||
| Net increase (decrease) in cash and cash equivalents | |||||||||||||||||
| Net cash impact of deconsolidation of consolidated investment products | ( | ( | ( | ||||||||||||||
| Cash and cash equivalents | |||||||||||||||||
| Beginning of period | |||||||||||||||||
| End of period | $ | $ | $ | ||||||||||||||
| Cash and cash equivalents as of the end of the period | |||||||||||||||||
| Cash and cash equivalents | $ | $ | $ | ||||||||||||||
| Cash and cash equivalents of consolidated investment products | |||||||||||||||||
| Cash and cash equivalents | $ | $ | $ | ||||||||||||||
| Supplementary information | |||||||||||||||||
| Noncash activity: | |||||||||||||||||
| Establishment of deferred tax assets | $ | $ | $ | ||||||||||||||
| Establishment of amounts payable under tax receivable agreements | |||||||||||||||||
| Increase in investment securities due to deconsolidation of consolidated investment products | |||||||||||||||||
| Operating lease assets obtained in exchange for operating leases | |||||||||||||||||
| Settlement of franchise capital liability via transfer of investment securities | |||||||||||||||||
| Non-cash contributions to consolidated investment products | |||||||||||||||||
| Cash paid for: | |||||||||||||||||
| Interest on borrowings | $ | $ | $ | ||||||||||||||
The accompanying notes are an integral part of the consolidated financial statements.
70
ARTISAN PARTNERS ASSET MANAGEMENT INC.
Notes to Consolidated Financial Statements
(U.S. currencies in thousands, except share and per share amounts and as otherwise indicated)
Note 1. Nature of Business and Organization
Nature of Business
Artisan Partners Asset Management Inc. (“APAM”), through its subsidiaries, is a global multi-asset investment platform focused on providing high value-added, active investment strategies in growing asset classes to sophisticated clients around the world. APAM and its subsidiaries are hereafter referred to collectively as “Artisan” or the “Company.”
Artisan’s autonomous investment teams manage a broad range of U.S., non-U.S. and global investment strategies that are diversified by asset class, market cap and investment style. Strategies are offered through multiple investment vehicles to accommodate a broad range of client mandates. Artisan offers its investment management services primarily to institutions and through intermediaries that operate with institutional-like decision-making processes and have long-term investment horizons.
Organization
On March 12, 2013, APAM completed its initial public offering (the “IPO”). APAM was formed for the purpose of becoming the general partner of Artisan Partners Holdings LP (“Artisan Partners Holdings” or “Holdings”) in connection with the IPO. Holdings is a holding company for the investment management business conducted under the name “Artisan Partners.” The reorganization (“IPO Reorganization”) established the necessary corporate structure to complete the IPO while at the same time preserving the ability of the firm to conduct operations through Holdings and its subsidiaries.
As its sole general partner, APAM controls the business and affairs of Holdings. As a result, APAM consolidates Holdings’ financial statements and records a noncontrolling interest for the equity interests in Holdings held by the limited partners of Holdings. At December 31, 2025, APAM held approximately 87 % of the equity ownership interest in Holdings.
Holdings, together with its wholly owned subsidiary, Artisan Investments GP LLC, controls a 100 % interest in Artisan Partners Limited Partnership (“APLP”), a multi-product investment management firm that is the principal operating subsidiary of Artisan Partners Holdings. APLP is registered as an investment adviser with the U.S. Securities and Exchange Commission under the Investment Advisers Act of 1940. APLP provides investment advisory services to traditional separate accounts and pooled investment vehicles, including Artisan Partners Funds, Inc. (“Artisan Funds”), Artisan Partners Global Funds plc (“Artisan Global Funds”) and Artisan sponsored private funds (“Artisan Private Funds”). Artisan Funds are a series of open-end, mutual funds registered under the Investment Company Act of 1940, as amended. Artisan Global Funds is a family of Ireland-domiciled UCITS funds. Artisan Private Funds consist of a number of Artisan-sponsored unregistered pooled investment vehicles.
Note 2. Summary of Significant Accounting Policies
Basis of presentation
The accompanying consolidated financial statements were prepared in accordance with U.S. generally accepted accounting principles (“U.S. GAAP”) and related rules and regulations of the SEC. The preparation of financial statements in conformity with U.S. GAAP requires management to make estimates or assumptions that affect the reported amounts and disclosures in the financial statements. Actual results could differ from these estimates or assumptions.
Principles of consolidation
Artisan’s policy is to consolidate all subsidiaries or other entities in which it has a controlling financial interest. The consolidation guidance requires an analysis to determine if an entity should be evaluated for consolidation using the voting interest entity (“VOE”) model or the variable interest entity (“VIE”) model. Under the VOE model, controlling financial interest is generally defined as a majority ownership of voting interests. Under the VIE model, controlling financial interest is defined as (i) the power to direct activities that most significantly impact the economic performance of the entity and (ii) the right to receive potentially significant benefits or the obligation to absorb potentially significant losses. Artisan generally consolidates VIEs in which it meets the power criteria and holds an equity ownership interest of greater than 10%. The consolidated financial statements include the accounts of APAM and all subsidiaries or other entities in which APAM has a direct or indirect controlling financial interest. All material intercompany balances have been eliminated in consolidation.
Artisan serves as the investment adviser to Artisan Funds, Artisan Global Funds and Artisan Private Funds. Artisan Funds and Artisan Global Funds are corporate entities, the business and affairs of which are managed by their respective boards of directors. The shareholders of the funds retain voting rights, including rights to elect and reelect members of their respective boards of directors. Each series of Artisan Funds is a VOE and is separately evaluated for consolidation under the VOE model. The shareholders of Artisan Global Funds lack simple majority liquidation rights, and as a result, each sub-fund of Artisan Global Funds is evaluated for consolidation under the VIE model. Artisan Private Funds are also evaluated for consolidation under the VIE model because third-party equity holders of the funds generally lack the ability to divest Artisan of its control of the funds.
71
From time to time, the Company makes investments in Artisan Funds, Artisan Global Funds and Artisan Private Funds. If the investment results in a controlling financial interest, APAM consolidates the fund, and the underlying activity of the entire fund is included in Artisan’s Consolidated Financial Statements. As of December 31, 2025, Artisan had a controlling financial interest in five sub-funds of Artisan Global Funds and three Artisan Private Funds and, as a result, these funds are included in Artisan’s Consolidated Financial Statements. Because these consolidated investment products meet the definition of investment companies under U.S. GAAP, Artisan has retained the specialized industry accounting principles for investment companies in the consolidated financial statements. See Note 6, “Variable Interest Entities and Consolidated Investment Products” for additional details.
Cash and cash equivalents
Foreign currency translation
Assets and liabilities of foreign operations whose functional currency is not the U.S. dollar are translated at prevailing year-end exchange rates. Revenue and expenses of such foreign operations are translated at average exchange rates during the year. The net effect of the translation adjustment for foreign operations is included in other comprehensive income (loss) in the Consolidated Statements of Comprehensive Income. The cumulative effect of translation adjustments is included in accumulated other comprehensive income (loss) and noncontrolling interests - Artisan Partners Holdings in the Consolidated Statements of Financial Condition, based on period-end ownership levels.
Accounts receivable
Accounts receivable are carried at invoiced amounts and consist primarily of investment advisory fees that have been earned, but not yet received from clients. Due to the short-term nature of the receivables, the carrying values of these assets approximate fair value. The accounts receivable balance does not include any allowance for doubtful accounts as Artisan believes all accounts receivable balances are fully collectible. There has not been any bad debt expense recorded for the years ended December 31, 2025, 2024 and 2023.
Investment securities
Investment securities consist of nonconsolidated investments in shares of Artisan Funds, Artisan Global Funds and Artisan Private Funds. Investments provide exposure to various risks, including price risk (the risk of a potential future decline in value of the investment) and foreign currency risk. Investments are carried at fair value based on net asset values as of the valuation date.
Realized and unrealized gains (losses) on nonconsolidated investment securities are recorded in net investment gain (loss) of nonconsolidated investment products in the Consolidated Statements of Operations. Dividend income from these investments is recognized when earned and is also included in net investment gain (loss) of nonconsolidated investment products.
Property and equipment
Property and equipment are carried at cost, less accumulated depreciation. Depreciation is generally recognized on a straight-line basis over the estimated useful lives of the respective assets or the remaining lease term, whichever is shorter.
The estimated useful lives of property and equipment as of December 31, 2025 are as follows:
| Property and Equipment Type | Useful Life | |||||||
| Computers and equipment | to | |||||||
| Computer software | to | |||||||
| Furniture and fixtures | ||||||||
| Leasehold improvements | to | |||||||
Implementation costs incurred to develop or obtain internal-use software, including hosting arrangements, are capitalized and expensed on a straight-line basis over either the estimated useful life of the respective software or the term of the hosting arrangement.
72
Property and equipment is tested for impairment when there is an indication that the carrying amount of an asset may not be recoverable. When an asset is determined to not be recoverable, the impairment loss is measured based on the excess, if any, of the carrying value of the asset over its fair value.
Leases
Artisan has lease commitments for office space, parking structures and equipment, which are all accounted for as operating leases. Artisan records expense for operating leases on a straight-line basis over the lease term. Any lease incentives received by Artisan are also amortized on a straight-line basis over the lease term.
Artisan assesses its contractual arrangements for the existence of a lease at inception. Operating leases with an initial term greater than 12 months are recorded as operating lease assets and operating lease liabilities in the Consolidated Statements of Financial Condition. Lease components (e.g. fixed rental payments) and non-lease components (e.g. fixed common-area maintenance costs) are generally accounted for as a single component.
Operating lease liabilities are recognized at the lease commencement date based on the present value of lease payments over the lease term. Operating lease assets are recognized at the lease commencement date based on the present value of lease payments over the lease term, adjusted for prepaid rent and the remaining balance of lease incentives received. Artisan's lease agreements generally do not provide an implicit interest rate, and therefore the present value calculation uses Artisan's estimated incremental borrowing rate. A market-based approach is used to estimate the incremental borrowing rate for each individual lease using observable market interest rates and Artisan specific inputs. The lease terms include periods covered by options to extend or exclude periods covered by options to terminate the lease when it is reasonably certain that Artisan will exercise that option.
Cash and cash equivalents of consolidated investment products
Investment assets and liabilities of consolidated investment products
Redeemable noncontrolling interests
Redeemable noncontrolling interests represent third-party investors’ ownership interest in consolidated investment products. Third-party investors in consolidated investment products generally have the right to withdraw their capital, subject to certain conditions. Noncontrolling interests of consolidated investment products that are currently redeemable or convertible for cash or other assets at the option of the holder are classified as temporary equity.
Revenue recognition
Artisan’s investment advisory revenue is derived from contracts with customers in the form of investment management fees and performance fees.
Investment Management Fees
Investment management fees are generally computed as a percentage of AUM and are recognized as revenue at the end of each distinct service period. Management fees for providing investment advisory services are computed and billed in accordance with the underlying investment management agreements, which is generally on a monthly or quarterly basis. Investment management fees are presented net of cash rebates and expense reimbursements pursuant to contractual expense limitations of certain funds.
Performance Fees
A number of investment management agreements provide for performance-based fees or incentive allocations, collectively “performance fees”. Performance fees, if earned, are recognized upon completion of each contractually determined measurement period, which is generally quarterly or annually. Performance fees recognized within the Consolidated Statements of Operations are not subject to claw back as a result of performance declines subsequent to the most recent measurement date.
73
Revenue Recognition
Artisan accounts for asset management services as a single performance obligation that is satisfied over time, using a time-based measure of progress to recognize revenue. Customer consideration is variable due to the uncertainty of the value of AUM during each distinct service period. At the end of each period, Artisan records revenue for the actual amount of investment management fees earned for that period because the uncertainty has been resolved.
Performance fees are subject to the uncertainty of market volatility, and as a result, the entire amount of the variable consideration related to performance fees is constrained until the end of each measurement period. At the end of the measurement period, revenue is recorded for the actual amount of performance fees earned during that period because the uncertainty has been resolved. For performance fees with annual measurement periods, revenue recognized in the current period could relate to performance obligations that were partially satisfied in prior periods.
Customer Rebates and Expense Reimbursements
Artisan has contractually agreed to reimburse for expenses incurred to the extent necessary to limit annualized ordinary operating expenses incurred by certain funds to not more than a fixed percentage of the funds’ average daily net assets. Artisan may also contractually agree to pay fee rebates to certain investors in Artisan Global Funds. Artisan accounts for all reimbursements and rebates as a reduction of the transaction price (and, hence, of revenue) because the billing adjustments and payments represent consideration payable to customers and Artisan does not receive any distinct goods or services from the customers in exchange.
Share-based compensation
Share-based compensation expense is recognized based on the estimated grant date fair value on a straight-line basis over the requisite service period of the award. The initial requisite service period is generally five years for restricted share-based awards. For awards granted beginning in 2024, the five-year service vesting condition is waived for grantees that satisfy qualified retirement requirements and an age-plus-service condition. For grantees who meet the age-plus-service condition for a qualified retirement, the initial requisite service period for that award is equal to the grantee’s required retirement notice period, which is generally 12 or 18 months. The Company’s accounting policy is to record the impact of forfeitures when they occur.
Cash-based long-term incentive compensation awards (franchise capital awards)
Cash-based long-term incentive compensation awards, referred to as franchise capital awards, are awards granted to investment team professionals which are tied to the values of one of the investment strategies managed by the grantee’s investment team. Compensation expense is recognized over the requisite service period of the award and the amount of expense recorded considers changes in the fair value of the award as a result of the investment returns of the strategy tied to the award. The initial requisite service period is generally five years. For awards granted beginning in 2024, the five-year service vesting condition is waived for grantees that satisfy qualified retirement requirements and an age-plus-service condition. For grantees who meet the age-plus-service condition for a qualified retirement, the initial requisite service period for that award is equal to the grantee’s required retirement notice period, which is generally 12 or 18 months. As the awards will generally be paid out in cash upon vesting, the fair value of unvested awards is recorded as a liability based on the percentage of the service requirement that has been completed. The liability is recorded within accrued long-term incentive compensation in the Company’s Consolidated Statements of Financial Condition. The Company’s accounting policy is to record the impact of forfeitures when they occur.
Distribution, servicing and marketing
Artisan Funds has authorized certain financial services companies, broker-dealers, banks or other intermediaries, and in some cases other organizations designated by an authorized intermediary, to accept purchase, exchange, and redemption orders for shares of Artisan Funds on the funds’ behalf. Many intermediaries charge a fee for accounting and shareholder services provided to fund shareholders on the funds’ behalf. Those services typically include recordkeeping, transaction processing for shareholders’ accounts and other services.
Fees are either based on the number of accounts to which the intermediary provides such services or a percentage of the average daily value of fund shares held in such accounts. The funds pay a portion of such fees directly to the intermediaries, which are intended to compensate the intermediary for its provision of services of the type that would be provided by the funds’ transfer agent or other service providers if the shares were registered directly on the books of the funds’ transfer agent. Artisan pays the balance of those fees, which includes compensation to the intermediary for its distribution, servicing and marketing of Artisan Funds shares.
Artisan Global Funds also have arrangements pursuant to which Artisan is required to pay a portion of its investment management fee for distribution, servicing and marketing of Artisan Global Funds shares.
74
Distribution, servicing and marketing fees paid by Artisan are presented as an operating expense because Artisan is the principal in its role as the primary obligor related to these services. Expenses incurred were as follows:
| For the Years Ended December 31, | |||||||||||||||||
| 2025 | 2024 | 2023 | |||||||||||||||
| Expenses incurred with respect to Artisan Funds | $ | $ | $ | ||||||||||||||
| Expenses incurred with respect to Artisan Global Funds | |||||||||||||||||
| Other marketing expenses | |||||||||||||||||
| Total distribution, servicing and marketing | $ | $ | $ | ||||||||||||||
Accrued fees to intermediaries were $3.3 million and $2.8 million as of December 31, 2025 and 2024, respectively, and are included in accounts payable, accrued expenses and other in the Consolidated Statements of Financial Condition.
Loss contingencies
Artisan considers the assessment of loss contingencies as a significant accounting policy because of the significant uncertainty relating to the outcome of any potential legal actions and other claims and the difficulty of predicting the likelihood and range of the potential liability involved, coupled with the material impact on Artisan’s results of operations that could result from legal actions or other claims and assessments. Artisan recognizes estimated costs to defend as incurred. Potential loss contingencies are reviewed at least quarterly and are adjusted to reflect the impact and status of settlements, rulings, advice of counsel and other information pertinent to a particular matter. Significant differences could exist between the actual cost required to investigate, litigate and/or settle a claim or the ultimate outcome of a suit and management’s estimate. These differences could have a material impact on Artisan’s results of operations, financial position or cash flows. Recoveries of losses are recognized in the Consolidated Statements of Operations when receipt is deemed probable. No loss contingencies were recorded at December 31, 2025, 2024 and 2023. Currently, there are no legal or administrative proceedings that management believes may have a material effect on Artisan’s consolidated financial position, cash flows or results of operations.
Commitments
Income taxes
Artisan accounts for income taxes under the asset and liability method, which requires the recognition of deferred tax assets and liabilities for the future tax consequences attributable to temporary differences between the financial statement carrying amounts and tax bases of assets and liabilities. Deferred tax assets and liabilities are measured using enacted tax rates expected to apply to taxable income in the years in which those temporary differences are expected to be realized or settled. Artisan recognizes a valuation allowance if it is more likely than not that some portion or all of the deferred tax assets will not be realized.
Artisan accounts for uncertain income tax positions by recognizing the impact of a tax position in its consolidated financial statements when Artisan believes it is more likely than not that the tax position would not be sustained upon examination by the appropriate tax authorities based on the technical merits of the position.
Comprehensive income (loss)
Partnership distributions
Artisan makes distributions to its partners for purposes of paying income taxes as required under the terms of Artisan Partners Holdings’ partnership agreement. Tax distributions are calculated utilizing the highest combined individual federal, state and local income tax rate among the various locations in which the partners, as a result of owning their interests in the partnership, are subject to tax, assuming maximum applicability of the phase-out of itemized deductions contained in the Internal Revenue Code that apply to any specific tax year. Artisan also makes additional distributions under the terms of the partnership agreement. Distributions are recorded in the financial statements on the declaration date.
Earnings per share
Basic earnings per share is computed under the two-class method by dividing income available to Class A common stockholders by the weighted average number of Class A common shares outstanding during the period. Unvested restricted share-based awards are excluded from the number of Class A common shares outstanding for the basic earnings per share calculation because the shares have not yet been earned by employees. Income available to Class A common stockholders is computed by reducing
75
net income attributable to APAM by earnings (both distributed and undistributed) allocated to participating securities, according to their respective rights to participate in those earnings. Except for certain performance share units in 2024 and 2023, unvested share-based awards are participating securities because the awards include non-forfeitable dividend rights during the vesting period. Class B and Class C common shares do not share in profits of APAM and therefore are not reflected in the calculations.
Diluted earnings per share is computed under the more dilutive of the treasury stock method or the two-class method. The weighted average number of Class A common shares outstanding during the period is increased by the assumed conversion of nonparticipating unvested share-based awards into Class A common stock using the treasury stock method.
Recent accounting pronouncements
In September 2025, the Financial Accounting Standards Board (“FASB”) issued Accounting Standards Update (“ASU”) 2025-06, “Intangibles — Goodwill and Other — Internal-Use Software (Subtopic 350-40): Targeted Improvements to the Accounting for Internal-Use Software,” which removes all references to software development project stages so that the guidance is neutral to different software development methods. The amendment eliminates the project stage model and clarifies that capitalization of internal-use software costs commences when management has authorized and committed funding for the project and it is probable that software will be completed and used to perform the function intended. The Company is required to adopt the guidance for the year ending December 31, 2028. The Company is currently evaluating the impact of the ASU on its Consolidated Financial Statements.
In November 2024, the FASB issued ASU 2024-03, “Disaggregation of Income Statement Expenses”, which requires disclosure of additional information and disaggregation of certain expenses included in the income statement. The Company is required to adopt the guidance for the year ending December 31, 2027. The Company is currently evaluating the impact of this ASU on its Consolidated Financial Statements.
Note 3. Investment Securities
Artisan’s investments in equity securities consist of investments in Artisan Funds, Artisan Global Funds and Artisan Private Funds. The disclosures below detail Artisan’s investments, excluding money market funds and consolidated investment products. Investments held by consolidated investment products are described in Note 6, “Variable Interest Entities and Consolidated Investment Products”.
| As of December 31, 2025 | As of December 31, 2024 | ||||||||||
| Seed investments in equity securities | $ | $ | |||||||||
| Seed investments in equity securities accounted for under the equity method | |||||||||||
| Compensation plan investments in equity securities | |||||||||||
| Compensation plan investment securities accounted for under the equity method | |||||||||||
| Total investment securities | $ | $ | |||||||||
Unrealized gain (loss) related to investment securities held for the periods indicated below were as follows:
| For the Years Ended December 31, | |||||||||||||||||
| 2025 | 2024 | 2023 | |||||||||||||||
| Unrealized gain (loss) in the period on investment securities held at the end of the period | $ | $ | $ | ||||||||||||||
Note 4. Fair Value Measurements
The table below presents information about Artisan’s assets and liabilities that are measured at fair value and the valuation techniques Artisan utilized to determine such fair value. The financial instruments held by consolidated investment products are excluded from the table below and are presented in Note 6, “Variable Interest Entities and Consolidated Investment Products”.
In accordance with ASC 820, fair value is defined as the price that Artisan would receive upon selling an investment in an orderly transaction to an independent buyer in the principal or most advantageous market for the investment. The following three-tier fair value hierarchy prioritizes the inputs used in measuring fair value:
•Level 1 – Observable inputs such as quoted (unadjusted) market prices in active markets for identical securities.
•Level 2 – Other significant observable inputs (including but not limited to quoted prices for similar instruments, interest rates, prepayment speeds, credit risk, etc.).
•Level 3 – Significant unobservable inputs (including Artisan’s own assumptions in determining fair value).
76
The following provides the hierarchy of inputs used to derive the fair value of Artisan’s assets and liabilities that are financial instruments as of December 31, 2025 and 2024:
| Assets and Liabilities at Fair Value | |||||||||||||||||||||||||||||
| Total | NAV Practical Expedient (No Fair Value Level) | Level 1 | Level 2 | Level 3 | |||||||||||||||||||||||||
| December 31, 2025 | |||||||||||||||||||||||||||||
| Assets | |||||||||||||||||||||||||||||
Money market funds (1) | $ | $ | $ | $ | $ | ||||||||||||||||||||||||
| Equity securities | |||||||||||||||||||||||||||||
| December 31, 2024 | |||||||||||||||||||||||||||||
| Assets | |||||||||||||||||||||||||||||
Money market funds (1) | $ | $ | $ | $ | $ | ||||||||||||||||||||||||
| Equity securities | |||||||||||||||||||||||||||||
(1) Money market funds are included within the cash and cash equivalents line on the Consolidated Statements of Financial Condition. | |||||||||||||||||||||||||||||
Note 5. Borrowings
Artisan’s borrowings consist of the following as of December 31, 2025 and 2024:
Maturity (1) | Outstanding Balance at December 31, 2025 | Outstanding Balance at December 31, 2024 | Interest Rate Per Annum | ||||||||||||||||||||
| Revolving credit agreement | August 2027 | $ | $ | NA | |||||||||||||||||||
| Senior notes | |||||||||||||||||||||||
| Series D | August 2025 | % | |||||||||||||||||||||
| Series E | August 2027 | % | |||||||||||||||||||||
| Series F | August 2032 | % | |||||||||||||||||||||
| Series G | August 2030 | % | |||||||||||||||||||||
| Total gross borrowings | |||||||||||||||||||||||
| Debt issuance costs | ( | ( | |||||||||||||||||||||
| Total borrowings | $ | $ | |||||||||||||||||||||
(1) The Company is not required to make principal payments on any of the outstanding obligations prior to contractual maturity. | |||||||||||||||||||||||
The fair value of borrowings was approximately $180.3 million and $182.5 million as of December 31, 2025 and 2024, respectively. Fair value was determined based on future cash flows, discounted to present value using current market interest rates. The inputs are categorized as Level 2 in the fair value hierarchy, as defined in Note 4, “Fair Value Measurements”.
On August 15, 2025, Artisan Partners Holdings LP issued $50 million of 5.43 % Series G Senior Notes and used the proceeds, along with cash on hand, to repay the $60 million of 4.29 % Series D Senior Notes that matured on August 16, 2025. The Company incurred debt issuance costs of $0.5 million related to the notes which are amortized as interest expense over the life of the instrument.
The financial covenants contained in the note purchase agreement for the Series G Senior Notes are the same as the covenants contained in the Company’s note purchase agreements for the Series E and Series F Senior Notes.
The fixed interest rate on each series of unsecured notes is subject to a one percentage point increase in the event Holdings receives a below-investment grade rating and any such increase will continue to apply until an investment grade rating is received.
77
Revolving credit agreement - Artisan Partners Holdings maintains a $100.0 million revolving credit facility that matures in August 2027. Any loans outstanding under the revolving credit agreement bear interest at a rate per annum equal to, at the Company’s election, (i) adjusted Term SOFR plus an applicable margin ranging from 1.25 % to 2.25 %, depending on Holdings’ leverage ratio (as defined in the revolving credit agreement) or (ii) an alternate base rate equal to the highest of (a) Citibank, N.A.’s prime rate, (b) the federal funds effective rate plus 0.50 % and (c) the adjusted Term SOFR for a one-month interest period plus 1.00 %, plus, in each case, an applicable margin ranging from 0.25 % to 1.25 %, depending on Holdings’ leverage ratio. Unused commitments will bear interest at a rate that ranges from 0.15 % to 0.45 %, depending on Holdings’ leverage ratio.
As of and for the year-ended December 31, 2025, there were no borrowings outstanding under the $100.0 million revolving credit agreement and the interest rate on the unused commitment was 0.15 %.
The unsecured notes and the revolving credit agreement contain certain restrictive financial covenants including a limitation on the leverage ratio of Holdings and a minimum interest coverage ratio. The Company was in compliance with all debt covenants as of December 31, 2025.
Interest expense incurred on the unsecured notes and revolving credit agreement was $7.8
Note 6. Variable Interest Entities and Consolidated Investment Products
Artisan serves as the investment adviser for various types of investment products, consisting of both VIEs and VOEs. Artisan consolidates an investment product if it has a controlling financial interest in the entity. See Note 2, “Summary of Significant Accounting Policies”. Any such entities are collectively referred to herein as consolidated investment products or CIPs.
As of December 31, 2025, Artisan is considered to have a controlling financial interest in five sub-funds of Artisan Global Funds and three Artisan Private Funds, with an aggregate direct equity investment in the consolidated investment products of $143.0 million, of which $105.5 million is related to seed investments and $37.5 million is related to compensation plan investments.
Artisan’s maximum exposure to loss in connection with the assets and liabilities of CIPs is limited to its direct equity investment, while the potential benefit is limited to the management and performance fees received and the return on its direct equity investment. With the exception of Artisan’s direct equity investment, the assets of CIPs are not available to Artisan’s creditors, nor are they available to Artisan for general corporate purposes. In addition, third-party investors in the CIPs have no recourse to the general credit of the Company.
Management and performance fees earned from CIPs are eliminated from revenue upon consolidation. See Note 17, “Related Party Transactions” for additional information on management and performance fees earned from CIPs.
Third-party investors’ ownership interest in CIPs is presented as redeemable noncontrolling interests in the Consolidated Statements of Financial Condition as third-party investors have the right to withdraw their capital, subject to certain conditions. Net income attributable to third-party investors is reported as net income (loss) attributable to noncontrolling interests - consolidated investment products in the Consolidated Statements of Operations.
During the year ended December 31, 2025, the Company determined that it no longer had a controlling financial interest in one Artisan Private Fund as a result of third party capital contributions. Upon loss of control, the fund was deconsolidated and the related assets, liabilities and equity of the fund were derecognized from the Company’s consolidated statements of financial condition. There was no net impact to the consolidated statement of operations for the year ended December 31, 2025. Artisan generally does not recognize a gain or loss upon deconsolidation of investment products as the assets and liabilities of CIPs are carried at fair value. Artisan’s direct equity investment, which was $29.8 million at the time of deconsolidation, was reclassified from investment assets of consolidated investment products to investment securities.
As of December 31, 2025, Artisan held direct equity investments of $21.5 million in VIEs for which the Company does not hold a controlling financial interest. These direct equity investments consisted of seed and compensation plan investments in sub-funds of Artisan Global Funds and Artisan Private Funds, both of which are accounted for under the equity method of accounting because Artisan has significant influence over the funds.
78
Fair Value Measurements - Consolidated Investment Products
Investments held by CIPs are reflected at fair value. Short and long positions on equity securities are valued based upon closing prices of the security on the exchange or market designated by the accounting agent or pricing vendor as the principal exchange. The closing price may represent last sale price, official closing price, a closing auction or other information depending on market convention. Short and long positions on fixed income instruments are valued at market value. Market values are generally evaluations based on prices provided by independent pricing vendors, which may consider, among other factors, the prices at which securities actually trade, broker-dealer quotations, pricing formulas, estimates of market values obtained from yield data relating to investments or securities with similar characteristics and/or discounted cash flow models that might be applicable. Short-term investments are comprised of repurchase agreements and U.S. Treasury obligations. Repurchase agreements are valued at cost plus accrued interest and U.S. Treasury obligations are valued using the same principles as fixed income securities. Derivative assets and liabilities are generally comprised of put and call options on securities and indices and forward foreign currency contracts. Put and call options are valued at the mid price (average of bid price and ask price) as provided by the pricing vendor at the close of trading on the contract’s principal exchange. Open forward foreign currency contracts are valued using the market spot rate. Private equity investments are valued at market value, which are generally evaluations based on estimates of market values obtained using valuation multiples on key financial metrics and/or discounted cash flow models.
The following tables present the fair value hierarchy levels of assets and liabilities held by CIPs measured at fair value as of December 31, 2025 and 2024:
| Assets and Liabilities at Fair Value | ||||||||||||||
| Total | Level 1 | Level 2 | Level 3 | |||||||||||
| December 31, 2025 | ||||||||||||||
| Assets | ||||||||||||||
| Money market funds | $ | $ | $ | $ | ||||||||||
| Equity securities - long position | ||||||||||||||
| Fixed income instruments - long position | ||||||||||||||
| Derivative assets | ||||||||||||||
| Liabilities | ||||||||||||||
| Derivative liabilities | $ | $ | $ | $ | ||||||||||
| December 31, 2024 | ||||||||||||||
| Assets | ||||||||||||||
| Money market funds | $ | $ | $ | $ | ||||||||||
| Equity securities - long position | ||||||||||||||
| Fixed income instruments - long position | ||||||||||||||
| Derivative assets | ||||||||||||||
| Private equity | ||||||||||||||
| Liabilities | ||||||||||||||
| Fixed income instruments - short position | $ | $ | $ | $ | ||||||||||
| Derivative liabilities | ||||||||||||||
| Reverse repurchase agreements | ||||||||||||||
CIP balances included in the Company's Consolidated Statements of Financial Condition were as follows:
| As of December 31, 2025 | As of December 31, 2024 | ||||||||||
| Net CIP assets included in the table above | $ | $ | |||||||||
| Net CIP assets (liabilities) not included in the table above | ( | ||||||||||
| Total Net CIP assets | |||||||||||
| Less: redeemable noncontrolling interests | |||||||||||
| Artisan’s direct equity investment in CIPs | $ | $ | |||||||||
79
Note 7. Noncontrolling Interests - Holdings
Net income attributable to noncontrolling interests - Artisan Partners Holdings in the Consolidated Statements of Operations represents the portion of earnings or loss attributable to the equity ownership interests in Holdings held by the limited partners of Holdings. As of December 31, 2025, APAM held approximately 87 % of the equity ownership interests in Holdings.
Limited partners of Artisan Partners Holdings are entitled to exchange partnership units (along with a corresponding number of shares of Class B or C common stock of APAM, as applicable) for shares of Class A common stock from time to time (the "Holdings Common Unit Exchanges"). The Holdings Common Unit Exchanges increase APAM's equity ownership interest in Holdings and result in an increase to deferred tax assets and amounts payable under the tax receivable agreements. See Note 11, “Income Taxes and Related Payments”.
In order to maintain the one-to-one correspondence of the number of Holdings partnership units and APAM common shares, Holdings will issue one general partner (“GP”) unit to APAM for each share of Class A common stock issued by APAM.
For the years ended December 31, 2025, 2024 and 2023, APAM’s equity ownership interest in Holdings has increased as a result of the following transactions:
| Holdings GP Units | Limited Partnership Units | Total | APAM Ownership % | |||||||||||
Balance at January 1, 2023 | % | |||||||||||||
Issuance of APAM Restricted Shares, Net | % | |||||||||||||
Delivery of Shares Underlying RSUs and PSUs (1) | % | |||||||||||||
Holdings Common Unit Exchanges (1) | ( | % | ||||||||||||
Forfeitures from Employee Terminations (1) | ( | ( | % | |||||||||||
Balance at December 31, 2023 | % | |||||||||||||
Issuance of APAM Restricted Shares, Net (1) | % | |||||||||||||
Delivery of Shares Underlying RSUs and PSUs (1) | % | |||||||||||||
| Holdings Common Unit Exchanges | ( | % | ||||||||||||
Forfeitures from Employee Terminations (1) | ( | ( | % | |||||||||||
Balance at December 31, 2024 | % | |||||||||||||
Issuance of APAM Restricted Shares, Net (1) | % | |||||||||||||
Delivery of Shares Underlying RSUs and PSUs (1) | % | |||||||||||||
Holdings Common Unit Exchanges (1) | ( | % | ||||||||||||
Forfeitures from Employee Terminations (1) | ( | ( | % | |||||||||||
Balance at December 31, 2025 | % | |||||||||||||
(1) The impact of the transaction on APAM’s ownership percentage was less than 1%. | ||||||||||||||
Changes in ownership of Holdings are accounted for as equity transactions because APAM continues to have a controlling interest in Holdings. Additional paid-in capital and noncontrolling interests - Artisan Partners Holdings in the Consolidated Statements of Financial Condition are adjusted to reallocate Holdings’ historical equity to reflect the change in APAM’s ownership of Holdings.
The reallocation of equity had the following impact on the Consolidated Statements of Financial Condition:
| Statements of Financial Condition | For the Years Ended December 31, | ||||||||||
2025 | 2024 | ||||||||||
| Additional paid-in capital | $ | ( | $ | ||||||||
| Noncontrolling interests - Artisan Partners Holdings | ( | ||||||||||
| Accumulated other comprehensive income (loss) | ( | ( | |||||||||
| Net impact to financial condition | $ | $ | |||||||||
In addition to the reallocation of historical equity, the change in ownership resulted in an increase to deferred tax assets and additional paid-in capital of $0.1 1.1
80
Note 8. Stockholders’ Equity
APAM - Stockholders’ Equity
APAM had the following authorized and outstanding equity as of December 31, 2025 and 2024, respectively:
| Outstanding | |||||||||||||||||||||||||||||
| Authorized | December 31, 2025 | December 31, 2024 | Voting Rights (1) | Economic Rights | |||||||||||||||||||||||||
| Common shares | |||||||||||||||||||||||||||||
Class A, par value $ | Proportionate | ||||||||||||||||||||||||||||
Class B, par value $ | None | ||||||||||||||||||||||||||||
Class C, par value $ | None | ||||||||||||||||||||||||||||
(1) The Company’s employees to whom Artisan has granted equity have entered into a stockholders agreement with respect to all shares of APAM common stock they have acquired from the Company and any shares they may acquire from the Company in the future, pursuant to which they are granted an irrevocable voting proxy to a Stockholders Committee. As of December 31, 2025, Artisan’s employees held | |||||||||||||||||||||||||||||
APAM is dependent on cash generated by Holdings to fund any dividends. Generally, Holdings will make distributions to all of its partners, including APAM, based on the proportionate share of ownership each has in Holdings. APAM will fund dividends to its stockholders from its proportionate share of those distributions after provision for its taxes and other obligations. APAM declared and paid the following dividends per share during the years ended December 31, 2025, 2024 and 2023:
| For the Years Ended December 31, | ||||||||||||||||||||||||||
| Type of Dividend | Class of Stock | 2025 | 2024 | 2023 | ||||||||||||||||||||||
| Quarterly | Class A Common | $ | $ | $ | ||||||||||||||||||||||
| Special Annual | Class A Common | $ | $ | $ | ||||||||||||||||||||||
81
The following table summarizes APAM’s stock transactions for the years ended December 31, 2025, 2024 and 2023:
| Total Stock Outstanding | Class A Common Stock(1) | Class B Common Stock | Class C Common Stock | |||||||||||
Balance at January 1, 2023 | ||||||||||||||
| Holdings Common Unit Exchanges | — | ( | ( | |||||||||||
| Delivery of Shares Underlying RSUs and PSUs | — | |||||||||||||
| Restricted Share Award Grants | — | — | ||||||||||||
| Restricted Share Award Net Share Settlement | ( | ( | — | — | ||||||||||
| Employee/Partner Terminations | ( | ( | — | — | ||||||||||
Balance at December 31, 2023 | ||||||||||||||
| Holdings Common Unit Exchanges | — | ( | ( | |||||||||||
| Delivery of Shares Underlying RSUs and PSUs | — | |||||||||||||
| Restricted Share Award Grants | — | — | ||||||||||||
| Restricted Share Award Net Share Settlement | ( | ( | — | — | ||||||||||
| Employee/Partner Terminations | ( | ( | ( | |||||||||||
Balance at December 31, 2024 | ||||||||||||||
| Holdings Common Unit Exchanges | — | ( | ( | |||||||||||
| Delivery of Shares Underlying RSUs and PSUs | — | — | ||||||||||||
| Restricted Share Award Grants | — | — | ||||||||||||
| Restricted Share Award Net Share Settlement | ( | ( | — | — | ||||||||||
| Employee/Partner Terminations | ( | ( | ( | |||||||||||
(1) There were | ||||||||||||||
Each Class A, Class B, Class D and Class E common unit of Holdings (together with the corresponding share of Class B or Class C common stock) is exchangeable for one share of Class A common stock. The corresponding shares of Class B and Class C common stock are immediately canceled upon any such exchange.
Upon termination of employment with Artisan, an employee-partner’s Class B common units are exchanged for Class E common units and the corresponding shares of Class B common stock are canceled. APAM issues the former employee-partner a number of shares of Class C common stock equal to the former employee-partner’s number of Class E common units. Class E common units are exchangeable for Class A common stock subject to the same restrictions and limitations on exchange applicable to the other common units of Holdings.
Artisan Partners Holdings - Partners’ Equity
Holdings makes distributions of its net income to the holders of its partnership units for income taxes as required under the terms of the partnership agreement and also makes additional distributions under the terms of the partnership agreement as required. The distributions are recorded in the financial statements on the declaration date, or on the payment date in lieu of a declaration date. Holdings’ partnership distributions for the years ended December 31, 2025, 2024 and 2023 were as follows:
| For the Years Ended December 31, | |||||||||||||||||
| 2025 | 2024 | 2023 | |||||||||||||||
| Holdings Partnership Distributions to Limited Partners | $ | $ | $ | ||||||||||||||
| Holdings Partnership Distributions to APAM | |||||||||||||||||
| Total Holdings Partnership Distributions | $ | $ | $ | ||||||||||||||
Distributions to limited partners are recorded as a reduction to consolidated stockholders’ equity while distributions to APAM are eliminated upon consolidation.
82
Note 9. Revenue From Contracts with Customers
The following table presents a disaggregation of investment advisory revenue by type and vehicle for the years ended December 31, 2025, 2024 and 2023:
| For the Years Ended December 31, | |||||||||||||||||
| 2025 | 2024 | 2023 | |||||||||||||||
| Management fees | |||||||||||||||||
| Artisan Funds | $ | $ | $ | ||||||||||||||
| Artisan Global Funds | |||||||||||||||||
Separate accounts and other(1) | |||||||||||||||||
| Performance fees | |||||||||||||||||
Separate accounts and other(1) | |||||||||||||||||
Total revenues(2) | $ | $ | $ | ||||||||||||||
(1) Separate accounts and other revenue consists of fees earned from vehicles other than Artisan Funds or Artisan Global Funds. | |||||||||||||||||
(2) All fees earned from consolidated investment products were eliminated upon consolidation and therefore are omitted from this table. See Note 17, “Related Party Transactions”. | |||||||||||||||||
The following table presents the balances of receivables related to contracts with customers:
| Customer | As of December 31, 2025 | As of December 31, 2024 | |||||||||
| Artisan Funds | $ | $ | |||||||||
| Artisan Global Funds | |||||||||||
| Separate accounts and other | |||||||||||
| Total receivables from contracts with customers | |||||||||||
| Non-customer receivables | |||||||||||
| Accounts receivable | $ | $ | |||||||||
Artisan Funds and Artisan Global Funds are billed on the last day of each month. Artisan Funds and Artisan Global Funds make payments on the same day the invoice is received for the majority of the invoiced amount. The remainder of the invoice is generally paid in the month following receipt of the invoice. Separate accounts and other clients are generally billed on a monthly or quarterly basis, with payments due within 30 days of billing.
Artisan had no
Non-customer receivables include state tax payments made on behalf of certain limited partners, which are then netted from subsequent distributions or payments to the limited partners, as well as redemptions of investments that have not yet been collected.
Note 10. Compensation and Benefits
Total compensation and benefits consist of the following:
| For the Years Ended December 31, | |||||||||||||||||
| 2025 | 2024 | 2023 | |||||||||||||||
Salaries, incentive compensation and benefits (1) | $ | $ | $ | ||||||||||||||
| Long-term cash incentive compensation expense | |||||||||||||||||
| Restricted share-based award compensation expense | |||||||||||||||||
| Long-term incentive compensation expense | |||||||||||||||||
| Total compensation and benefits | $ | $ | $ | ||||||||||||||
(1) Excluding long-term incentive compensation expense. | |||||||||||||||||
83
Incentive compensation
Cash incentive compensation paid to members of Artisan’s investment teams and members of its distribution team is generally based on formulas that are tied directly to revenues. The majority of this incentive compensation is earned on a quarterly basis and paid in the quarter following the quarter in which it was earned with the exception of fourth quarter incentive compensation, which is earned and paid in the fourth quarter of the year. Cash incentive compensation paid to most other employees is determined based on individual performance and Artisan’s overall results during the applicable year and is generally paid on an annual basis.
Long-term incentive compensation awards consist of both APAM restricted share-based awards and long-term cash awards, which are referred to as franchise capital awards. These awards are described in more detail below.
Restricted share-based awards
APAM has granted a combination of restricted stock awards, restricted stock units and performance share units (collectively referred to as “restricted share-based awards” or “awards”) of Class A common stock to employees.
Standard Restricted Shares. Standard restricted shares are generally subject to a pro rata five-year service vesting condition.
Career Shares. Career shares are generally subject to both (i) a qualifying retirement (as defined in the award agreement) condition and, (ii) a pro rata five-year service vesting condition.
Franchise Shares. Like career shares, franchise shares are generally subject to both (i) a pro rata five-year service vesting condition and (ii) a qualifying retirement condition. In addition, franchise shares, which are only granted to investment team members, are subject to a Franchise Protection Clause, which provides that the number of shares that ultimately vest depends on whether certain conditions relating to client cash flows are met. If such conditions are not met, compensation cost related to unvested shares will be reversed.
Performance Share Units (PSUs). PSUs were generally subject to (i) a three-year service vesting condition, (ii) certain performance conditions related to the Company’s adjusted operating margin and total shareholder return compared to a peer group over a three-year performance period and (iii) for one-half of the PSUs eligible to vest at the end of the performance period, a qualifying retirement condition. The number of shares of Class A common stock that were ultimately issued in connection with each PSU award depended upon the outcome of the performance, market and qualified retirement conditions. For the portion of a PSU award with a “performance condition” under ASC 718, expense was recognized over the service period if it was probable that the performance condition would be achieved. PSUs have not been granted since 2022. As of December 31, 2025, all unvested PSUs had met the required three-year performance conditions, but remain outstanding subject to meeting a qualifying retirement vesting condition.
For awards granted beginning in 2024, the pro rata five-year service vesting condition is waived for grantees that satisfy the qualified retirement requirements and an age-plus-service condition.
Unvested restricted share-based awards are subject to forfeiture. Grantees are generally entitled to dividends or dividend equivalents on unvested and vested awards. 5,514,579 shares of Class A common stock were reserved and available for issuance under the Artisan Partners Asset Management Inc. 2023 Omnibus Incentive Compensation Plan (the “Plan”) as of December 31, 2025.
84
The following tables summarize the restricted share-based award activity for the years ended December 31, 2025, 2024 and 2023:
| Weighted-Average Grant Date Fair Value | Restricted Stock Awards and Restricted Stock Units | ||||||||||
Unvested at January 1, 2023 | $ | ||||||||||
| Granted | |||||||||||
| Forfeited | ( | ||||||||||
| Vested | ( | ||||||||||
Unvested at January 1, 2024 | $ | ||||||||||
| Granted | |||||||||||
| Forfeited | ( | ||||||||||
| Vested | ( | ||||||||||
Unvested at January 1, 2025 | $ | ||||||||||
| Granted | |||||||||||
| Forfeited | ( | ||||||||||
| Vested | ( | ||||||||||
Unvested at December 31, 2025 | $ | ||||||||||
| Weighted-Average Grant Date Fair Value | Performance Share Units | ||||||||||
Unvested at January 1, 2023 | $ | ||||||||||
| Granted | |||||||||||
| Forfeited | |||||||||||
| Vested | ( | ||||||||||
Unvested at January 1, 2024 | $ | ||||||||||
| Granted | |||||||||||
| Forfeited | |||||||||||
| Adjustment for performance results achieved | |||||||||||
| Vested | ( | ||||||||||
Unvested at January 1, 2025 (2) | $ | ||||||||||
| Granted | |||||||||||
| Forfeited | |||||||||||
Adjustment for performance results achieved (1) | |||||||||||
Vested (1) | ( | ||||||||||
Unvested at December 31, 2025 (2) | $ | ||||||||||
(1) During the year ended December 31, 2025, the | |||||||||||
(2) | |||||||||||
The aggregate vesting date fair value of awards that vested during the years ended December 31, 2025, 2024 and 2023 was approximately $35.0 million, $24.6 million and $21.2 million, respectively. The unrecognized compensation expense for the unvested restricted stock awards and restricted stock units as of December 31, 2025 was $44.4 million with a weighted average recognition period of 2.5 years remaining. The unrecognized compensation expense for the unvested performance share units as of December 31, 2025 was $0.4 million with a weighted average recognition period of 0.8 years remaining.
85
During the years ended December 31, 2025 and 2024, the Company withheld a total of 212,360 and 161,650 restricted shares, respectively. The Company paid $9.0 million and $6.8 million for the years ended December 31, 2025 and 2024, respectively, as a result of net share settlements to satisfy employee tax withholding obligations. These net share settlements had the effect of shares repurchased and retired by the Company, as they reduced the number of shares outstanding.
Long-term cash awards (franchise capital awards)
During the years ended December 31, 2025 and 2024, Artisan granted $46.8 million and $39.4 million, respectively, of franchise capital awards to investment team members. The franchise capital awards are subject to the same long-term vesting and forfeiture provisions as restricted share-based awards, as described above. The value of franchise capital awards will increase or decrease from the grant date through the vesting date based on the investment performance of specified strategies managed by the grantee’s investment team.
The Company hedges its economic exposure to the change in value of franchise capital awards due to market movements by investing the cash reserved for the awards in the underlying investments. The franchise capital award liability and the underlying investment holdings are marked to market each quarter. The change in value of the award liability is recognized as a compensation expense on a straight-line basis over the required service period. The change in value of the underlying investment holdings is recognized in non-operating income (expense) in the period of change. While there is a timing difference between the recognition of the compensation expense and the offsetting investment gain or loss, the compensation expense and investment income will net to zero at the end of the multi-year vesting period for all awards that ultimately vest.
The change in value of the investments had the following impact on the Consolidated Statements of Operations:
| For the Years Ended December 31, | ||||||||||||||||||||
| Statement of Operations Section | Statement of Operations Line Item | 2025 | 2024 | 2023 | ||||||||||||||||
| Operating expenses (benefit) | Compensation and benefits | $ | $ | $ | ||||||||||||||||
| Non-operating income (expense) | Net investment gain (loss) of nonconsolidated investment products | |||||||||||||||||||
| Non-operating income (expense) | Net investment gain (loss) of consolidated investment products | |||||||||||||||||||
The unrecognized compensation expense for the unvested franchise capital awards as of December 31, 2025 was $118.8 million with a weighted average recognition period of 2.2 years remaining.
Note 11. Income Taxes and Related Payments
APAM is subject to U.S. federal, state and local income taxation on APAM’s allocable portion of Holdings’ income, as well as foreign income taxes payable by Holdings’ subsidiaries.
Income (or loss) from continuing operations before income tax expense disaggregated between domestic and foreign:
| For the Years Ended December 31, | |||||||||||||||||
| 2025 | 2024 | 2023 | |||||||||||||||
| Domestic | $ | $ | $ | ||||||||||||||
| Foreign | |||||||||||||||||
| Total | $ | $ | $ | ||||||||||||||
86
Components of the provision for income taxes consist of the following:
| For the Years Ended December 31, | |||||||||||||||||
| Current: | 2025 | 2024 | 2023 | ||||||||||||||
| Federal | $ | $ | $ | ||||||||||||||
| State and local | |||||||||||||||||
| Foreign | |||||||||||||||||
| Total | |||||||||||||||||
| Deferred: | |||||||||||||||||
| Federal | |||||||||||||||||
| State and local | |||||||||||||||||
| Total | |||||||||||||||||
| Income tax expense | $ | $ | $ | ||||||||||||||
During the fiscal year ended December 31, 2025, the Company adopted ASU 2023-09 to enhance income tax disclosure relating to income taxes paid and the reconciliation of rates. The income taxes paid by the Company are as follows:
| For the Years Ended December 31, | |||||||||||||||||
| 2025 | 2024 | 2023 | |||||||||||||||
| Federal | $ | $ | $ | ||||||||||||||
| State and local | |||||||||||||||||
| Foreign | |||||||||||||||||
| Total | $ | $ | $ | ||||||||||||||
Income taxes paid (net of refunds) exceeds 5 percent of total income taxes paid in the following jurisdictions:
| For the Years Ended December 31, | |||||||||||||||||
| 2025 | 2024 | 2023 | |||||||||||||||
| State and local: | |||||||||||||||||
New York City (1) | |||||||||||||||||
| Total | $ | $ | $ | ||||||||||||||
(1) New York City income taxes paid (net of refunds) exceeded 5 percent of total income taxes paid for the year ended December 31, 2023. For comparative purposes, we have also included the taxes paid for the years ended December 31, 2025 and 2024. | |||||||||||||||||
87
The differences between income taxes expected at the U.S. federal statutory income tax rate and income taxes reported were as follows:
| For the Years Ended December 31, | ||||||||||||||||||||||||||
| 2025 | 2024 | 2023 | ||||||||||||||||||||||||
| $ | % | $ | % | $ | % | |||||||||||||||||||||
| U.S. federal statutory rate | $ | % | $ | % | $ | % | ||||||||||||||||||||
Current state and local income taxes, net of federal income tax effect (1) (2) | ||||||||||||||||||||||||||
| Foreign tax effects | ( | ( | ||||||||||||||||||||||||
| Effect of changes in tax laws or rates enacted in the current period | ||||||||||||||||||||||||||
OBBBA adjustment (2) | ||||||||||||||||||||||||||
| Effect of cross-border tax laws | ||||||||||||||||||||||||||
| Tax credits | ( | |||||||||||||||||||||||||
| Nontaxable or nondeductible items | ||||||||||||||||||||||||||
Rate benefit from noncontrolling interest (3) | ( | ( | ( | ( | ( | ( | ||||||||||||||||||||
| Limits on executive compensation | ||||||||||||||||||||||||||
| Excess tax benefits on share-based compensation | ( | ( | ( | ( | ( | ( | ||||||||||||||||||||
| Other | ( | ( | ||||||||||||||||||||||||
| Changes in unrecognized tax benefits | ||||||||||||||||||||||||||
| Effective tax rate | $ | % | $ | % | $ | % | ||||||||||||||||||||
(1) State and local taxes in New York City, California and New York made up the majority (greater than 50 percent) of the tax effect in this category. | ||||||||||||||||||||||||||
(2) As a result of the enactment of the One Big Beautiful Bill Act (“OBBBA”) on July 4, 2025, the Company recorded a $ | ||||||||||||||||||||||||||
(3) For the years ended December 31, 2025, 2024 and 2023 approximately | ||||||||||||||||||||||||||
In connection with the IPO, APAM entered into two tax receivable agreements (“TRAs”). The first TRA, generally provides for the payment by APAM to a private equity fund (the “Pre-H&F Corp Merger Shareholder”) or its assignees of 85 % of the applicable cash savings, if any, of U.S. federal, state and local income taxes that APAM actually realizes (or is deemed to realize in certain circumstances) as a result of (i) the tax attributes of the preferred units APAM acquired in the merger of a wholly-owned subsidiary of the Pre-H&F Corp Merger Shareholder into APAM in March 2013 and (ii) tax benefits related to imputed interest.
The second TRA generally provides for the payment by APAM to current or former limited partners of Holdings or their assignees of 85 % of the applicable cash savings, if any, of U.S. federal, state and local income taxes that APAM actually realizes (or is deemed to realize in certain circumstances) as a result of (i) certain tax attributes of their partnership units sold to APAM or exchanged (for shares of Class A common stock, convertible preferred stock or other consideration) and that are created as a result of such sales or exchanges and payments under the TRAs and (ii) tax benefits related to imputed interest. Under both agreements, APAM generally will retain the benefit of the remaining 15 % of the applicable tax savings.
For purposes of the TRAs, cash savings of income taxes are calculated by comparing APAM’s actual income tax liability to the amount it would have been required to pay had it not been able to utilize any of the tax benefits subject to the TRAs, unless certain assumptions apply. The TRAs will continue in effect until all such tax benefits have been utilized or expired, unless APAM exercises its right to terminate the agreements or payments under the agreements are accelerated in the event that APAM materially breaches any of its material obligations under the agreements.
88
The actual increase in tax basis, as well as the amount and timing of any payments under these agreements, will vary depending upon a number of factors, including the timing of sales or exchanges by the holders of limited partnership units, the price of the Class A common stock at the time of such sales or exchanges, whether such sales or exchanges are taxable, the amount and timing of the taxable income APAM generates in the future and the tax rate then applicable and the portion of APAM’s payments under the TRAs constituting imputed interest or depreciable basis or amortizable basis.
Payments under the TRAs, if any, will be made pro rata among all TRA counterparties entitled to payments on an annual basis to the extent APAM has sufficient taxable income to utilize the increased depreciation and amortization charges and imputed interest deductions. Artisan expects to make one or more payments under the TRAs, to the extent they are required, prior to or within 125 days after APAM’s U.S. federal income tax return is filed for each fiscal year. Interest on the TRA payments will accrue from the due date (without extension) of such tax return until such payments are made.
Amounts payable under the TRAs are estimates which may be impacted by factors, including but not limited to, expected tax rates, projected taxable income and projected ownership levels and are subject to change. Changes in the estimates of amounts payable under tax receivable agreements are recorded as non-operating income (loss) in the Consolidated Statements of Operations.
The change in the Company’s deferred tax assets related to the tax benefits described above and the change in corresponding amounts payable under the TRAs for the years ended December 31, 2025 and 2024 is summarized as follows:
| Deferred Tax Asset - Amortizable Basis | Amounts Payable Under TRAs | ||||||||||
| December 31, 2023 | $ | $ | |||||||||
2024 Holdings Common Unit Exchanges | |||||||||||
| Amortization | ( | — | |||||||||
Payments under TRAs (1) | — | ( | |||||||||
| Change in estimate | ( | ||||||||||
| December 31, 2024 | $ | $ | |||||||||
2025 Holdings Common Unit Exchanges | |||||||||||
| Amortization | ( | — | |||||||||
Payments under TRAs (1) | — | ( | |||||||||
| Change in estimate | ( | ||||||||||
| December 31, 2025 | $ | $ | |||||||||
(1) Interest payments of $ | |||||||||||
Net deferred tax assets comprise the following:
| As of December 31, 2025 | As of December 31, 2024 | ||||||||||
| Deferred tax assets: | |||||||||||
Amortizable basis (1) | $ | $ | |||||||||
Other (2) | |||||||||||
| Total deferred tax assets | |||||||||||
Less: valuation allowance (3) | |||||||||||
| Net deferred tax assets | $ | $ | |||||||||
(1) Represents the unamortized step-up of tax basis and other tax attributes from the merger and partnership unit sales and exchanges described above. These future tax benefits are subject to the TRA agreements. | |||||||||||
(2) Represents the net deferred tax assets associated with Artisan’s investment in Holdings, related primarily to incentive compensation plan deduction timing differences. These future tax benefits are not subject to the TRA agreements. The decrease in the year ended December 31, 2025, is predominantly associated with the $10.7 million charge associated with the enactment of the OBBBA. | |||||||||||
(3) Artisan assessed whether the deferred tax assets would be realizable and determined based on its history of taxable income that the benefits would more likely than not be realized. Accordingly, no valuation allowance is required. | |||||||||||
89
Accounting standards establish a minimum threshold for recognizing, and a process for measuring, the benefits of income tax return positions in financial statements. The change in the Company’s gross unrecognized tax benefits for the years ended December 31, 2025, 2024 and 2023 is summarized as follows:
| For the Years Ended December 31, | |||||||||||||||||
| 2025 | 2024 | 2023 | |||||||||||||||
| Balance at beginning of year | $ | $ | $ | ||||||||||||||
| Additions for tax positions of prior years | |||||||||||||||||
| Reductions for tax positions of prior years | ( | ( | |||||||||||||||
| Tax positions related to the current year | |||||||||||||||||
| Settlements with taxing authorities | |||||||||||||||||
| Balance at end of year | $ | $ | $ | ||||||||||||||
If recognized, $1.7 million and $1.4 million of the benefits recorded as of December 31, 2025 and 2024, respectively, would favorably impact the effective tax rate in future periods.
The Company recognizes interest and penalties related to unrecognized tax benefits as a component of the income tax provision. Accrued interest on uncertain tax positions was $0.3 million and $0.2 million as of December 31, 2025 and 2024, respectively, and is excluded from the unrecognized tax benefits total above. The gross unrecognized tax benefit is recorded within accounts payable, accrued expenses and other in the Company's Consolidated Statements of Financial Condition.
In the normal course of business, Artisan is subject to examination by federal and certain state, local and foreign tax regulators. As of December 31, 2025, U.S. federal income tax returns filed for the years 2022 through 2024 are open and therefore subject to examination. State, local and foreign income tax returns filed are generally subject to examination from 2021 to 2024.
Note 12. Earnings Per Share
The computation of basic and diluted earnings per share for the years ended December 31, 2025, 2024 and 2023 were as follows:
| For the Years Ended December 31, | |||||||||||||||||
| Basic and Diluted Earnings Per Share | 2025 | 2024 | 2023 | ||||||||||||||
| Numerator: | |||||||||||||||||
| Net income attributable to APAM | $ | $ | $ | ||||||||||||||
| Less: Allocation to participating securities | |||||||||||||||||
| Net income available to common stockholders | $ | $ | $ | ||||||||||||||
| Denominator: | |||||||||||||||||
| Basic weighted average shares outstanding | |||||||||||||||||
| Dilutive effect of nonparticipating equity awards | |||||||||||||||||
| Diluted weighted average shares outstanding | |||||||||||||||||
| Earnings per share - Basic | $ | $ | $ | ||||||||||||||
| Earnings per share - Diluted | $ | $ | $ | ||||||||||||||
Allocation to participating securities in the table above primarily represents dividends paid to holders of unvested restricted share-based awards, which reduces net income available to common stockholders.
The Holdings limited partnership units are anti-dilutive primarily due to the impact of public company expenses. Unvested restricted share-based awards with non-forfeitable dividend rights during the vesting period are considered participating securities and are therefore anti-dilutive.
The following table summarizes the weighted-average shares outstanding that are excluded from the calculation of diluted earnings per share because their effect would have been anti-dilutive:
| For the Years Ended December 31, | |||||||||||||||||
| Anti-Dilutive Weighted Average Shares Outstanding | 2025 | 2024 | 2023 | ||||||||||||||
| Holdings limited partnership units | |||||||||||||||||
| Unvested restricted share-based awards | |||||||||||||||||
| Total | |||||||||||||||||
90
Note 13. Benefit Plans
Artisan has a 401(k) plan and similar foreign arrangements for its non-U.S. employees, under which it provides matching contributions on employees’ pre-tax contributions. Expenses related to Artisan’s benefits plans for the years ended December 31, 2025, 2024 and 2023 were $12.0 million, $11.7 million and $11.0 million, respectively, and are included in compensation and benefits in the Consolidated Statements of Operations.
Artisan provides an opportunity for eligible employees to participate in Artisan’s financial growth and success through phantom equity awards, pursuant to the Artisan Partners Holdings LP Phantom Equity Plan. The phantom equity awards provide participants the right to receive cash payments upon vesting based on the trading price of APAM’s Class A common stock. Awards made under the Phantom Equity Plan are liability awards and are subject to vesting on a pro-rata basis over five years. Award recipients must be employed by Artisan on the vesting date in order to receive payment.
Expense related to the Phantom Equity Plan for the years ended December 31, 2025, 2024 and 2023 was $1.5 million, $1.5 million and $2.2 million, respectively, and is included in compensation and benefits in the Consolidated Statements of Operations. The liability at December 31, 2025 and 2024 for the plan was $1.4 million and $1.6 million, respectively.
Note 14. Indemnifications
In the normal course of business, APAM enters into agreements that include indemnities in favor of third parties. Holdings has also agreed to indemnify APAM as its general partner, Artisan Investment Corporation (“AIC”) as its former general partner, the directors and officers of APAM, the directors and officers of AIC as its former general partner, the members of its former Advisory Committee, and its partners, directors, officers, employees and agents. Holdings’ subsidiaries may also have similar agreements to indemnify their respective general partner(s), directors, officers, directors and officers of their general partner(s), partners, members, employees, and agents. The Company’s maximum exposure under these arrangements is unknown, as this would involve future claims that may be made against the Company that have not yet occurred. APAM maintains insurance policies that may provide coverage against certain claims under these indemnities.
Note 15. Property and Equipment
The composition of property and equipment at December 31, 2025 and 2024 was as follows:
| As of December 31, 2025 | As of December 31, 2024 | ||||||||||
| Computers and equipment | $ | $ | |||||||||
| Computer software | |||||||||||
| Furniture and fixtures | |||||||||||
| Leasehold improvements | |||||||||||
| Total cost | $ | $ | |||||||||
| Less: Accumulated depreciation | ( | ( | |||||||||
| Property and equipment, net of accumulated depreciation | $ | $ | |||||||||
Depreciation expense totaled $9.2 million, $9.9 million and $9.3 million for the years ended December 31, 2025, 2024 and 2023, respectively.
91
Note 16. Leases
Operating lease expense was as follows:
| For the Years Ended December 31, | ||||||||||||||||||||||||||
| Lease Type | Classification | 2025 | 2024 | 2023 | ||||||||||||||||||||||
| Parking leases | Compensation and benefits | $ | $ | $ | ||||||||||||||||||||||
Office leases (1) | Occupancy | |||||||||||||||||||||||||
Variable lease cost (2) | Occupancy | |||||||||||||||||||||||||
Short-term lease cost (2) | Occupancy | |||||||||||||||||||||||||
| Office equipment leases | Communication and technology | |||||||||||||||||||||||||
| Total operating lease expense | $ | $ | $ | |||||||||||||||||||||||
(1) Office lease expense includes an impairment charge of $ | ||||||||||||||||||||||||||
(2) Variable and short-term lease costs are excluded from the measurement of operating lease liabilities. | ||||||||||||||||||||||||||
The table below presents the maturity of operating lease liabilities:
| As of December 31, 2025 | |||||
| 2026 | $ | ||||
| 2027 | |||||
| 2028 | |||||
| 2029 | |||||
| 2030 | |||||
| Thereafter | |||||
| Total undiscounted lease payments | |||||
| Adjustment to discount to present value | ( | ||||
| Operating lease liabilities | $ | ||||
As of December 31, 2025, none of the options to extend lease terms were reasonably certain of being exercised. Other information related to leases was as follows:
| For the Years Ended December 31, | |||||||||||||||||
| 2025 | 2024 | 2023 | |||||||||||||||
| Weighted average discount rate | % | % | % | ||||||||||||||
| Weighted average remaining lease term | |||||||||||||||||
| Operating cash flows for operating leases | |||||||||||||||||
Note 17. Related Party Transactions
Several of the current executive officers and directors of APAM, or entities associated with those individuals, are or were limited partners of Holdings. As a result, certain transactions (such as TRA payments) between Artisan and the limited partners of Holdings are considered to be related party transactions with respect to these persons.
Holdings also makes estimated state tax payments on behalf of certain limited partners, including related parties. These payments are then netted from subsequent distributions or other payments to the limited partners. As of both December 31, 2025 and 2024, amounts due to or from Holdings’ limited partners, including related parties, were negligible.
Affiliate transactions—Artisan Funds
Artisan has an agreement to serve as the investment adviser to Artisan Funds, with which certain Artisan employees are affiliated. Under the terms of the agreement, which is reviewed and continued by the board of directors of Artisan Funds annually, a fee is paid to Artisan based on an annual percentage of the average daily net assets of each Artisan Fund ranging from 0.60 % to 1.05 %. Artisan has contractually agreed to reimburse for expenses incurred to the extent necessary to limit annualized ordinary operating expenses incurred by certain of the Artisan Funds to not more than a fixed percentage (ranging from 0.83 % to 1.50 %) of a fund’s average daily net assets. In addition, Artisan may voluntarily waive fees or reimburse any of the Artisan Funds for other
92
expenses. Expense waivers and reimbursements are reflected as a reduction of management fees within the Consolidated Statements of Operations. The officers and directors of Artisan Funds who are affiliated with Artisan receive no compensation from the funds.
Investment advisory fees for managing Artisan Funds and amounts reimbursed by Artisan for fees and expenses (including management fees) are as follows:
| For the Years Ended December 31, | |||||||||||||||||
| Artisan Funds | 2025 | 2024 | 2023 | ||||||||||||||
| Investment advisory fees (Gross of expense reimbursements) | $ | $ | $ | ||||||||||||||
Elimination of fees from consolidated investment products (1) | ( | ||||||||||||||||
| Consolidated investment advisory fees (Gross of expense reimbursements) | $ | $ | $ | ||||||||||||||
| Expense reimbursements | $ | $ | $ | ||||||||||||||
Elimination of expense reimbursements from consolidated investment products (1) | ( | ||||||||||||||||
| Consolidated expense reimbursements | $ | $ | $ | ||||||||||||||
(1) Investment advisory fees and expense reimbursements related to consolidated investment products are eliminated from revenue upon consolidation. | |||||||||||||||||
Affiliate transactions—Artisan Global Funds
Artisan has an agreement to serve as the investment manager to Artisan Global Funds, with which certain Artisan employees are affiliated. Under the terms of these agreements, a fee is paid based on an annual percentage of the average daily net assets of each fund ranging from 0.35 % to 1.85 %. Artisan reimburses each sub-fund of Artisan Global Funds to the extent that sub-fund’s annual expenses, not including Artisan’s fee, exceed certain levels, which range from 0.10 % to 0.20 %. In addition, Artisan may voluntarily waive fees or reimburse any of the Artisan Global Funds for other expenses. The directors of Artisan Global Funds who are also employees of Artisan receive no compensation from the funds.
Investment advisory fees for managing Artisan Global Funds and amounts reimbursed by Artisan are as follows:
| For the Years Ended December 31, | |||||||||||||||||
| Artisan Global Funds | 2025 | 2024 | 2023 | ||||||||||||||
| Investment advisory fees (Gross of expense reimbursements) | $ | $ | $ | ||||||||||||||
Elimination of fees from consolidated investment products (1) | ( | ( | ( | ||||||||||||||
| Consolidated investment advisory fees (Gross of expense reimbursements) | $ | $ | $ | ||||||||||||||
| Expense reimbursements | $ | $ | $ | ||||||||||||||
Elimination of expense reimbursements from consolidated investment products (1) | ( | ( | ( | ||||||||||||||
| Consolidated expense reimbursements | $ | $ | $ | ||||||||||||||
(1) Investment advisory fees and expense reimbursements related to consolidated investment products are eliminated from revenue upon consolidation. | |||||||||||||||||
Affiliate transactions—Artisan Private Funds
Pursuant to written agreements, Artisan serves as the investment manager and acts as the general partner for certain Artisan Private Funds. Under the terms of these agreements, Artisan earns a management fee and for certain funds is entitled to receive either an allocation of profits or a performance-based fee. In addition, Artisan has agreed to reimburse certain funds to the extent that expenses, excluding Artisan’s management fee, performance fee and certain transaction related costs, exceed certain levels, which range from 0.10 % to 1.00 % per annum of the net assets of the fund. Artisan may also voluntarily waive fees or reimburse the funds for other expenses. The directors of Artisan Private Funds and the officers of the general partners of the Artisan Private Funds who are affiliated with Artisan receive no compensation from the funds.
Artisan and certain related parties, including employees, officers and members of the Company’s Board, have invested in one or more of the Artisan Private Funds and, for certain of those investments, do not pay a management fee, performance fee or incentive allocation.
93
Investment advisory fees for managing Artisan Private Funds and amounts reimbursed by Artisan are as follows:
| For the Years Ended December 31, | |||||||||||||||||
| Artisan Private Funds | 2025 | 2024 | 2023 | ||||||||||||||
| Investment advisory fees (Gross of expense reimbursements) | $ | $ | $ | ||||||||||||||
Elimination of fees from consolidated investment products (1) | ( | ( | ( | ||||||||||||||
| Consolidated investment advisory fees (Gross of expense reimbursements) | $ | $ | $ | ||||||||||||||
| Expense reimbursements | $ | $ | $ | ||||||||||||||
Elimination of expense reimbursements from consolidated investment products (1) | ( | ( | ( | ||||||||||||||
| Consolidated expense reimbursements | $ | $ | $ | ||||||||||||||
(1) Investment advisory fees and expense reimbursements related to consolidated investment products are eliminated from revenue upon consolidation. | |||||||||||||||||
Note 18. Segment Information
Artisan operates as one segment in the investment management business. The Company’s Chief Operating Decision Maker (the “CODM”) is its Chief Executive Officer and President, who reviews financial information on a consolidated basis for purposes of allocating resources and assessing financial performance. The CODM uses consolidated Net Income attributable to Artisan Partners Asset Management as presented within the Consolidated Statements of Operations (“net income”), among other consolidated metrics, to evaluate segment performance. Based on net income, as well as the other metrics, the CODM determines whether to use profits to invest in growth initiatives or return cash to shareholders through dividends while considering the level of resources available through review of “Total assets” as presented within the consolidated statements of financial condition. The CODM reviews significant segment expenses at a level consistent with that presented in the Consolidated Statements of Operations with the exception of Compensation and Benefits which is reviewed at a more disaggregated level as presented in the table below for the years ended December 31, 2025, 2024 and 2023.
| For the Years Ended December 31, | |||||||||||||||||
| 2025 | 2024 | 2023 | |||||||||||||||
| Salaries | |||||||||||||||||
| Incentive compensation | |||||||||||||||||
| Benefits and payroll taxes | |||||||||||||||||
| Long-term incentive compensation | |||||||||||||||||
| Market valuation changes in compensation plans | |||||||||||||||||
| Total compensation and benefits | $ | $ | $ | ||||||||||||||
Artisan generates a portion of its revenues from clients domiciled in countries outside the United States. Revenues by geographic location based on client domicile for the years ended December 31, 2025, 2024 and 2023 were as follows:
| For the Years Ended December 31, | |||||||||||||||||
| 2025 | 2024 | 2023 | |||||||||||||||
| U.S. | $ | $ | $ | ||||||||||||||
| Non-U.S. | |||||||||||||||||
| Total revenues | $ | $ | $ | ||||||||||||||
The following table sets forth Artisan’s long-lived assets, which consist of net property and equipment and operating lease assets, by geographic area:
| As of December 31, 2025 | As of December 31, 2024 | ||||||||||
| U.S. | $ | $ | |||||||||
| Non-U.S. | |||||||||||
| Total long-lived assets | $ | $ | |||||||||
94
Note 19. Litigation Matters
In the normal course of business, Artisan may be subject to various legal and administrative proceedings. Currently, there are no legal or administrative proceedings that management believes may have a material effect on Artisan’s consolidated financial position, cash flows or results of operations.
Note 20. Subsequent Events
Long-term incentive awards
During the first quarter of 2026, the Board approved the grant of long-term incentive awards with a grant date fair value of $71.8 million, consisting of $21.2 million of restricted share-based awards and $50.6 million of franchise capital awards, to certain employees pursuant to the Company’s 2023 Omnibus Incentive Compensation Plan. The grant will be effective March 2, 2026. Compensation expense associated with these awards will be recognized on a straight-line basis over the requisite service period, which is generally five years unless the participant is qualified retirement eligible, in which case the requisite service period is the required retirement notification period. Expense for the franchise capital (cash based) awards will be variable based on the investment returns of the investment strategies to which the awards are allocated.
Distributions and dividends
APAM, acting as the general partner of Artisan Partners Holdings, declared, effective February 3, 2026, a distribution by Artisan Partners Holdings of $47.8 million to holders of Artisan Partners Holdings partnership units, including APAM. The Board declared, effective February 3, 2026, a quarterly dividend of $1.01 per share of Class A common stock and a special annual dividend of $0.57 per share of Class A common stock. Both APAM common stock dividends, a total of $1.58 per share, are payable on February 27, 2026 to stockholders of record as of February 13, 2026.
Acquisition of Grandview Property Partners
On January 2, 2026, the Company completed the acquisition of 100% of the equity interests of Grandview Property Partners (“Grandview”), a U.S. real estate private equity firm, pursuant to the definitive agreement announced on November 18, 2025. The acquisition of Grandview provided an entry point into a new asset class and expanded the Company’s multi-asset investment platform. Consideration included an up-front payment satisfied using cash on hand and contingent consideration payable upon achievement of specified AUM thresholds tied to future Grandview fund launches and the underlying performance of those funds.
The Company expects to complete the purchase price allocation in the first quarter of 2026. The acquisition does not meet any of the significance tests under Rule 1-02 of Regulation S-X; therefore, separate acquiree financial statements and pro forma financial information are not required. Since the acquisition closed after December 31, 2025, the accompanying consolidated financial statements do not reflect this transaction.
95
Item 9. Changes in and Disagreements With Accountants on Accounting and Financial Disclosure
None.
Item 9A. Controls and Procedures
Disclosure Controls and Procedures
We maintain disclosure controls and procedures, as defined in Rules 13a-15(e) and 15d-15(e) of the Securities Exchange Act of 1934, that are designed to ensure that information required to be disclosed in our reports filed or submitted under the Exchange Act is recorded, processed, summarized and reported within the time periods specified in the SEC’s rules and forms, and that such information is accumulated and communicated to our management, including our principal executive and principal financial officers, as appropriate, to allow for timely decisions regarding required disclosure.
Our management, including our Chief Executive Officer and Chief Financial Officer, evaluated the effectiveness of our disclosure controls and procedures (as such term is defined in Rule 13a-15(e) and 15d-15(e) under the Exchange Act) at December 31, 2025. Based on that evaluation, our Chief Executive Officer and Chief Financial Officer have concluded that our disclosure controls and procedures are effective.
Report of Management on Internal Control over Financial Reporting
Company management is responsible for establishing and maintaining adequate internal control over financial reporting as defined in Rules 13a-15(f) and 15d-15(f) under the Exchange Act. Our internal control over financial reporting is a process designed to provide reasonable assurance regarding the reliability of financial reporting and the preparation of financial statements for external purposes in accordance with generally accepted accounting principles.
Because of its inherent limitations, internal control over financial reporting may not prevent or detect misstatements. Also, projections of any evaluation of effectiveness to future periods are subject to the risk that controls may become inadequate because of changes in conditions, or that the degree of compliance with the policies or procedures may deteriorate.
Company management, including our Chief Executive Officer and Chief Financial Officer, evaluated the effectiveness of our internal control over financial reporting as of December 31, 2025, based on the 2013 version of the Internal Control - Integrated Framework set forth by the Committee of Sponsoring Organizations of the Treadway Commission in Internal Control - Integrated Framework. Based on that assessment, Company management concluded that the Company’s internal control over financial reporting was effective as of December 31, 2025.
The effectiveness of the Company’s internal control over financial reporting as of December 31, 2025, has been audited by PricewaterhouseCoopers LLP, an independent registered public accounting firm, as stated in their report appearing in Item 8, which expresses an unqualified opinion on the effectiveness of internal control over financial reporting as of December 31, 2025.
Changes in Internal Control over Financial Reporting
There have been no changes in internal control over financial reporting (as such term is defined in Rules 13a-15(f) under the Exchange Act), during the quarter ended December 31, 2025, that have materially affected, or are reasonably likely to materially affect our internal control over financial reporting.
Item 9B. Other Information
Item 9C. Disclosure Regarding Foreign Jurisdictions that Prevent Inspections
Not applicable.
96
PART III
Item 10. Directors, Executive Officers and Corporate Governance
The information required by this Item 10 (other than the information set forth below) will be set forth in our proxy statement for our 2026 Annual Meeting of Stockholders to be filed with the SEC within 120 days after December 31, 2025 (the “Proxy Statement”), under the sections titled “Proposal 1: Election of Directors” and “Board Composition and Leadership – Committees of the Board” and is incorporated herein by reference.
Executive Officers
The information required by this Item 10 with respect to our executive officers is included at the end of Part I of this Form 10-K under the heading “Information about our Executive Officers.”
Code of Ethics
The Board has adopted a Code of Business Conduct applicable to all directors, officers and employees of the Company to provide a framework for the highest standards of professional conduct and foster a culture of honesty and accountability. The Code of Business Conduct satisfies applicable SEC requirements and NYSE listing standards. The Code of Business Conduct is available under the Corporate Governance link on our website at www.apam.com.
We intend to post on our website at www.apam.com, all disclosures that are required by law or NYSE listing standards concerning any amendments to, or waivers from, any provision of our Code of Business Conduct.
Insider Trading Policy
We have adopted a Code of Ethics & Insider Trading Policy, applicable to our officers, employees and other individuals associated with us, and APAM has adopted an insider trading policy applicable to its non-employee directors, which collectively govern the purchase, sale, and other dispositions of our securities by directors, officers and employees of the Company and are designed to promote compliance with insider trading laws, rules and regulations, and listing standards applicable to the Company. A copy of each policy is filed as an exhibit to this report. In addition, with regard to the Company's trading in its own securities, it is the Company’s policy to comply with federal securities laws and applicable exchange listing requirements.
Item 11. Executive Compensation
The information required by this Item 11 will be set forth in the Proxy Statement, under the sections titled “Compensation Discussion and Analysis,” “Board Composition and Leadership – Compensation Committee Interlocks and Insider Participation” and “Director Compensation,” and is incorporated herein by reference.
Item 12. Security Ownership of Certain Beneficial Owners and Management and Related Stockholder Matters.
The information required by this Item 12 will be set forth in the Proxy Statement, under the sections titled “Equity Compensation Plan Information” and “Security Ownership of Certain Beneficial Owners and Management,” and is incorporated herein by reference.
Item 13. Certain Relationships and Related Transactions and Director Independence
The information required by this Item 13 will be set forth in the Proxy Statement, under the sections titled “Board Composition and Leadership – Director Independence” and “Relationships and Related Party Transactions,” and is incorporated herein by reference.
Item 14. Principal Accountant Fees and Services
The information required by this Item 14 will be set forth in the Proxy Statement, under the section titled “Ratification of the Appointment of PricewaterhouseCoopers LLP for the Fiscal Year Ending December 31, 2026,” and is incorporated herein by reference.
97
PART IV
Item 15. Exhibits and Financial Statement Schedules
(1) Financial Statements: The information required by this Item is contained in Item 8 of Part II of this report.
(2) Financial Statement Schedules: None
(3) Exhibits:
| Exhibit No. | Description | Form | File No. | Exhibit | Filing Date | Filed or Furnished Herewith | ||||||||||||||||||||||||||||||||
| 2.1 | 10-K | 001-35826 | 2.1 | February 25, 2016 | ||||||||||||||||||||||||||||||||||
| 3.1 | 10-K | 001-35826 | 3.1 | February 25, 2016 | ||||||||||||||||||||||||||||||||||
| 3.2 | 10-K | 001-35826 | 3.2 | February 25, 2016 | ||||||||||||||||||||||||||||||||||
| 4.1 | 10-K | 001-35826 | 4.1 | February 18, 2020 | ||||||||||||||||||||||||||||||||||
| 10.1 | 10-K | 001-35826 | 10.1 | February 25, 2016 | ||||||||||||||||||||||||||||||||||
| 10.2 | 10-K | 001-35826 | 10.2 | February 25, 2016 | ||||||||||||||||||||||||||||||||||
| 10.3 | 10-K | 001-35826 | 10.3 | February 25, 2016 | ||||||||||||||||||||||||||||||||||
| 10.4 | 10-K | 001-35826 | 10.4 | February 25, 2016 | ||||||||||||||||||||||||||||||||||
| 10.5 | 10-K | 001-35826 | 10.5 | February 22, 2024 | ||||||||||||||||||||||||||||||||||
| 10.6 | 10-K | 001-35826 | 10.5 | February 25, 2016 | ||||||||||||||||||||||||||||||||||
| 10.7 | 10-K | 001-35826 | 10.7 | February 22, 2024 | ||||||||||||||||||||||||||||||||||
| 10.8 | 10-K | 001-35826 | 10.6 | February 25, 2016 | ||||||||||||||||||||||||||||||||||
| 10.9 | 10-K | 001-35826 | 10.12 | February 25, 2016 | ||||||||||||||||||||||||||||||||||
| 10.10 | 10-K | 001-35826 | 10.14 | February 25, 2016 | ||||||||||||||||||||||||||||||||||
| 10.11 | 10-K | 001-35826 | 10.15 | February 25, 2016 | ||||||||||||||||||||||||||||||||||
| 10.12 | 10-K | 001-35826 | 10.12 | February 25, 2025 | ||||||||||||||||||||||||||||||||||
| 10.13 | 10-K | 001-35826 | 10.9 | February 25, 2016 | ||||||||||||||||||||||||||||||||||
| 10.14 | 10-K | 001-35826 | 10.8 | February 27 2023 | ||||||||||||||||||||||||||||||||||
| 10.15 | 10-K | 001-35826 | 10.10 | February 25, 2016 | ||||||||||||||||||||||||||||||||||
| 10.16 | 10-K | 001-35826 | 10.18 | February 25, 2016 | ||||||||||||||||||||||||||||||||||
| 10.17 | 10-K | 001-35826 | 10.13 | February 20, 2019 | ||||||||||||||||||||||||||||||||||
| 10.18 | 10-K | 001-35826 | 10.14 | February 20, 2019 | ||||||||||||||||||||||||||||||||||
| 10.19 | 10-K | 001-35826 | 10.15 | February 20, 2019 | ||||||||||||||||||||||||||||||||||
98
| Exhibit No. | Description | Form | File No. | Exhibit | Filing Date | Filed or Furnished Herewith | ||||||||||||||||||||||||||||||||
| 10.20 | 10-K | 001-35826 | 10.16 | February 20, 2019 | ||||||||||||||||||||||||||||||||||
| 10.21 | 10-K | 001-35826 | 10.17 | February 20, 2019 | ||||||||||||||||||||||||||||||||||
| 10.22 | 10-K | 001-35826 | 10.18 | February 18, 2020 | ||||||||||||||||||||||||||||||||||
| 10.23 | 10-K | 001-35826 | 10.19 | February 23, 2021 | ||||||||||||||||||||||||||||||||||
| 10.24 | 10-K | 001-35826 | 10.20 | February 22, 2022 | ||||||||||||||||||||||||||||||||||
| 10.25 | 10-K | 001-35826 | 10.20 | February 23, 2021 | ||||||||||||||||||||||||||||||||||
| 10.26 | 10-K | 001-35826 | 10.22 | February 22, 2022 | ||||||||||||||||||||||||||||||||||
| 10.27 | 10-K | 001-35826 | 10.23 | February 22, 2022 | ||||||||||||||||||||||||||||||||||
| 10.28 | 8-K | 001-35826 | 10.1 | June 1, 2023 | ||||||||||||||||||||||||||||||||||
| 10.29 | 8-K | 001-35826 | 10.02 | June 1, 2023 | ||||||||||||||||||||||||||||||||||
| 10.30 | 8-K | 001-35826 | 10.1 | January 30, 2024 | ||||||||||||||||||||||||||||||||||
| 10.31 | 8-K | 001-35826 | 10.2 | January 30, 2024 | ||||||||||||||||||||||||||||||||||
| 10.32 | 10-K | 001-35826 | 10.32 | February 22, 2024 | ||||||||||||||||||||||||||||||||||
| 10.33 | 10-K | 001-35826 | 10.33 | February 22, 2024 | ||||||||||||||||||||||||||||||||||
| 10.34 | 10-K | 001-35826 | 10.34 | February 22, 2024 | ||||||||||||||||||||||||||||||||||
| 10.35 | 10-K | 001-35826 | 10.35 | February 22, 2024 | ||||||||||||||||||||||||||||||||||
| 10.36 | 10-K | 001-35826 | 10.36 | February 22, 2024 | ||||||||||||||||||||||||||||||||||
| 10.37 | X | |||||||||||||||||||||||||||||||||||||
99
| Exhibit No. | Description | Form | File No. | Exhibit | Filing Date | Filed or Furnished Herewith | ||||||||||||||||||||||||||||||||
| 10.38 | 8-K | 001-35826 | 10.1 | August 18, 2017 | ||||||||||||||||||||||||||||||||||
| 10.39 | 8-K | 001-35826 | 10.1 | June 6, 2019 | ||||||||||||||||||||||||||||||||||
| 10.40 | 8-K | 001-35826 | 10.1 | December 7, 2021 | ||||||||||||||||||||||||||||||||||
| 10.41 | 8-K | 001-35826 | 10.1 | August 17, 2022 | ||||||||||||||||||||||||||||||||||
| 19.1 | X | |||||||||||||||||||||||||||||||||||||
| 19.2 | 10-K | 001-35826 | 19.2 | February 25, 2025 | ||||||||||||||||||||||||||||||||||
| 21.1 | X | |||||||||||||||||||||||||||||||||||||
| 23.1 | X | |||||||||||||||||||||||||||||||||||||
| 31.1 | X | |||||||||||||||||||||||||||||||||||||
| 31.2 | X | |||||||||||||||||||||||||||||||||||||
| 32.1 | X | |||||||||||||||||||||||||||||||||||||
| 32.2 | X | |||||||||||||||||||||||||||||||||||||
| 97.1 | 10-K | 001-35826 | 97 | February 25, 2025 | ||||||||||||||||||||||||||||||||||
| 101 | The following Extensible Business Reporting Language (XBRL) documents are collectively included herewith as Exhibit 101: (i) the Consolidated Statements of Financial Condition as of December 31, 2025 and 2024; (ii) the Consolidated Statements of Operations for the years ended December 31, 2025, 2024 and 2023; (iii) the Consolidated Statements of Comprehensive Income for the years ended December 31, 2025, 2024 and 2023; (iv) the Consolidated Statements of Changes in Stockholders’ Equity for the years ended December 31, 2025, 2024 and 2023; (v) the Consolidated Statements of Cash Flows for the years ended December 31, 2025, 2024 and 2023 and (vi) the Notes to Consolidated Financial Statements as of and for the years ended December 31, 2025, 2024 and 2023 | X | ||||||||||||||||||||||||||||||||||||
| 104 | Cover Page Interactive Data File (embedded within the Inline XBRL document contained in Exhibit 101) | X | ||||||||||||||||||||||||||||||||||||
(1) Indicates a management contract or compensatory plan or arrangement. | ||||||||||||||||||||||||||||||||||||||
(2) These certifications are deemed to be furnished and not filed for purposes of Sections 11 and 12 of the Securities Act of 1933 and Section 18 of the Securities Exchange Act of 1934. | ||||||||||||||||||||||||||||||||||||||
Item 16. Form 10-K Summary
None.
100
SIGNATURES
Pursuant to the requirements of Section 13 or 15(d) of the Securities Exchange Act of 1934, the registrant has duly caused this report to be signed on its behalf by the undersigned, thereunto duly authorized.
| Artisan Partners Asset Management Inc. | ||||||||
Dated: February 20, 2026 | By: | /s/ Jason A. Gottlieb | ||||||
| Jason A. Gottlieb Chief Executive Officer and President (principal executive officer) | ||||||||
| /s/ Charles J. Daley, Jr. | ||||||||
| Charles J. Daley, Jr. Executive Vice President, Chief Financial Officer and Treasurer (principal financial officer) | ||||||||
| /s/ Ryan G. Von Hoff | ||||||||
| Ryan G. Von Hoff Vice President, Chief Accounting Officer and Assistant Treasurer (principal accounting officer) | ||||||||
101
Pursuant to the requirements of the Securities Exchange Act of 1934, this report has been signed below by the following persons on behalf of the registrant and in the capacities indicated on the 20th day of February, 2026.
| Signature | Title | |||||||
| /s/ Jennifer A. Barbetta | Director | |||||||
| Jennifer A. Barbetta | ||||||||
| /s/ Matthew R. Barger | Director | |||||||
| Matthew R. Barger | ||||||||
| /s/ Clarence Kane Brenan | Director | |||||||
| Clarence Kane Brenan | ||||||||
| /s/ Eric R. Colson | Chair of the Board | |||||||
| Eric R. Colson | ||||||||
| /s/ Peter B. Crawford | Director | |||||||
| Peter B. Crawford | ||||||||
| /s/ Stephanie G. DiMarco | Director | |||||||
| Stephanie G. DiMarco | ||||||||
| /s/ Jeffrey A. Joerres | Director | |||||||
| Jeffrey A. Joerres | ||||||||
| /s/ Saloni S. Multani | Director | |||||||
| Saloni S. Multani | ||||||||
102

ARTISAN PARTNERS ASSET MANAGEMENT INC. 2023 OMNIBUS INCENTIVE COMPENSATION PLAN Class B Award Certificate Pursuant to the Artisan Partners Asset Management Inc. 2023 Omnibus Incentive Compensation Plan (as amended from time to time, the “Plan”), Artisan Partners Holdings LP (the “Partnership”) has granted Class B common units of the Partnership (“Class B Common Units”) to Grantee and Artisan Partners Asset Management Inc. (“Artisan”) has issued corresponding shares of Class B common stock, par value $0.01 per share (“APAM Class B Common Stock”) to Grantee as set forth below in consideration of Grantee’s service as an employee of Artisan or any of its subsidiaries. Grantee: [ ] Grant Date: [ ] Number of Class B Common Units: [ ] Number of corresponding shares of APAM Class B Common Stock: [ ] Vesting Schedule: 100% of the Class B Common Units will be fully vested as of the Grant Date. This award is subject to all of the terms, conditions and restrictions set forth in (i) Grantee’s Class B Award Agreement (including any schedules and appendices thereto) dated [ ], as may be amended from time to time in accordance with the provisions of the Plan (the “Award Agreement”), (ii) the Plan, (iii) the Fifth Amended and Restated Agreement of Limited Partnership of the Partnership, dated as of November 6, 2013 (the “Amended Partnership Agreement”), (iv) the Exchange Agreement, dated as of March 6, 2013, among Artisan and the LP Unitholders (as defined therein) from time to time (the “Exchange Agreement”), and (v) the Stockholders Agreement, dated as of March 12, 2013 (the “Stockholders Agreement” together with the agreements in (iii) and (iv), the “Applicable Agreements”), each of which has been provided to Grantee and is incorporated herein by reference. Grantee acknowledges receipt of copies of the Award Agreement, the Plan and the Applicable Agreements, has read and understands the terms and provisions thereof, has had the opportunity to consult with his or her legal, tax and financial advisors, and accepts this award subject to all of the terms and conditions of the Award Agreement, the Plan and the Applicable Agreements. Artisan may, in its sole discretion, deliver this Class B Award Certificate, the Award Agreement, the Plan, the Applicable Agreements or any other documents related to this award, by electronic means and request Grantee’s acceptance of this award and the terms of the Award Agreement by electronic means. Grantee hereby consents to receive such documents by electronic delivery, including by accessing such documents on a website, and agrees to accept this award and the terms of the Award Agreement through any on-line or electronic system utilized by Artisan for this purpose. Exhibit 10.37

Artisan Partners Asset Management Inc. Grantee By: [ ] [ ] Title: [ ] Artisan Partners Holdings LP By: [ ] Title: [ ]

ARTISAN PARTNERS ASSET MANAGEMENT INC. 2023 OMNIBUS INCENTIVE COMPENSATION PLAN CLASS B AWARD AGREEMENT This Class B Award Agreement (this “Award Agreement”) between [ ] (the “Grantee”), Artisan Partners Asset Management Inc. (“Artisan” or “the Company”) and Artisan Partners Holdings LP (the “Partnership”) is effective as of [ ], 2026. 1. The Plan. This award of Class B common units of the Partnership (“Class B Common Units”) is made pursuant to the Artisan Partners Asset Management Inc. 2023 Omnibus Incentive Compensation Plan (as amended, from time to time, the “Plan”). Capitalized terms used but not defined in this Award Agreement have the meanings as used or defined in the Plan. 2. Applicable Agreements. Grantee acknowledges receipt of a copy of, and acknowledges that upon grant of the Class B Common Units to Grantee in connection herewith, Grantee will be bound by the terms and conditions of each of (i) the Fifth Amended and Restated Agreement of Limited Partnership of the Partnership, dated as of November 6, 2013 (the “Amended Partnership Agreement”), (ii) the Exchange Agreement, dated as of March 6, 2013, among the Company and the LP Unitholders (as defined therein) from time to time (the “Exchange Agreement”), (iii) the Stockholders Agreement, dated as of March 12, 2013 (the “Stockholders Agreement” together with the agreements in (i) and (ii), the “Applicable Agreements”). Grantee further agrees to execute and acknowledge any other instruments requested by the Partnership to reflect Grantee’s status as a holder of Class B Common Units and a party to the Applicable Agreements, including any joinder agreements. In connection with the grant of Class B Common Units governed by the Award Agreement, the Company will issue Grantee a number of shares of Class B common stock, par value $0.01 per share (“APAM Class B Common Stock”), equal in number to the number of Class B Common Units subject to this Award Agreement. 3. Transferability. The transfer of any of Grantee’s Class B Common Units, including any transfer of economic rights, shall be subject to the terms of the Amended Partnership Agreement, which prohibits most transfers of Class B Common Units. 4. Exchange and Sale of Class B Common Units. There is no public market for the sale of Class B Common Units or APAM Class B Common Stock. To obtain liquidity, Grantee must first Exchange (as defined in the Exchange Agreement) Grantee’s Class B Common Units, together with an equal number of shares of APAM Class B Common Stock, for shares of the Company’s Class A common stock, par value $0.01 per share (“APAM Class A Common Stock”), in accordance with the Exchange Agreement. Exchanges may be made on the terms and subject to the conditions of the Exchange Agreement; provided, however, that no Exchange may occur until after the first anniversary of the date the Grantee accepts the award of Class B Common Units. After an Exchange, Grantee may sell the APAM Class A Common Stock subject to compliance with all applicable requirements under federal and state securities laws and restrictions contained in the Company’s Code of Ethics. 5. Mandatory Conversion on Termination of Employment. Pursuant to and in accordance with the Amended Partnership Agreement, upon Grantee’s termination of employment for any reason (i) each Class B Common Unit will be mandatorily exchanged for a Class E Common Unit, (ii) the Company will

issue Grantee a number of shares of its Class C Common Stock, par value $0.01 per share, equal in number to the number of Class E Common Units held by Grantee and (iii) the Company will automatically redeem and cancel the shares of APAM Class B Common Stock held by Grantee. 6. Certain Tax Matters. Grantee acknowledges that Grantee is responsible for all taxes arising from the grant and ownership of the Class B Common Units. Within fifteen (15) days of the grant hereunder, Grantee will pay to the Company, or otherwise provide for, to the satisfaction of the Company, applicable federal, state and local tax and social security withholding obligations of the Company. If Grantee fails to make such payment or otherwise satisfy such obligations, the Company shall, to the extent permitted by law, have the right to deduct such amounts from any payment of any kind otherwise due to Grantee. 7. Compliance with Securities Laws. The grant of Class B Common Units shall be subject to compliance by Artisan and Grantee with all applicable requirements under federal and state securities laws and with all applicable rules of the New York Stock Exchange. Class B Common Units will not be granted unless and until any then applicable requirements of federal and state laws and regulatory agencies have been fully complied with to the satisfaction of Artisan. 8. Entire Agreement. This Award Agreement, together with any Class B Common Unit award certificates, the Plan and the Applicable Agreements constitute the entire agreement and understanding of the parties with respect to any award granted hereunder and supersede all prior understandings and agreements (whether written or oral) between the Company and Grantee with respect to such award. 9. Notices. Any notice required to be given to Artisan under the terms of this Award Agreement will be in writing and delivered to Artisan’s Chief Legal Officer. Any notice required to be given to Grantee will be in writing and delivered to the address or addresses last maintained in the Company’s records. 10. Binding Effect. Any action taken or decision made in good faith by the Compensation Committee of the Board of Directors of Artisan in connection with the construction, administration or interpretation of this Award Agreement will lie within its sole and absolute discretion and will be final, conclusive and binding on Grantee and all persons claiming under or through Grantee. 11. Choice of Forum. As a condition to Grantee’s receipt of the Class B Common Units, Grantee hereby irrevocably submits to the exclusive jurisdiction of any state or federal court located in Delaware over any suit, action or proceeding arising out of or relating to the Plan or this Award Agreement. 12. Governing Law. This Award Agreement will be governed by and construed in accordance with the laws of the State of Delaware without regard to its principles of conflict of laws. 13. Electronic Delivery and Signature. Artisan may, in its sole discretion, deliver this Award Agreement, the Plan, the Applicable Agreements and any other documents related to the Class B Common Units by electronic means and request Grantee’s agreement to the terms thereof by electronic means. Grantee hereby consents to receive such documents by electronic delivery, including by accessing such documents on a website, and agrees to accept the terms of the Award Agreement through any on-line or electronic system utilized by Artisan for this purpose.

Artisan Partners Asset Management Inc. Grantee By: [ ] [ ] Title: [ ] Artisan Partners Holdings LP By: [ ] Title: [ ]

1 2 A U G U S T 2 0 2 5 Code of Ethics & Insider Trading Policy Exhibit 19.1

Table of Contents Code of Ethics at a Glance ....................................................................................................................................................... 1 Definitions ................................................................................................................................................................................ 3 Fiduciary Duty to Clients and Related Principles .............................................................................................................. 6 Covered Persons Under the Code of Ethics ....................................................................................................................... 6 Disclosure and Certification Requirements ....................................................................................................................... 6 INITIAL DISCLOSURE OF ACCOUNTS, HOLDINGS AND CERTIFICATIONS ................................................................................................................................. 7 ANNUAL DISCLOSURE OF ACCOUNTS, HOLDINGS AND CERTIFICATIONS ............................................................................................................................. 7 QUARTERLY TRANSACTION DISCLOSURES ...................................................................................................................................................................................... 8 Conducting Personal Securities Transactions ................................................................................................................... 9 CODE OF ETHICS REPORTING AND PRECLEARANCE CHART .................................................................................................................................................... 11 PRECLEARANCE EXEMPTIONS FOR CERTAIN SECURITY TYPES ................................................................................................................................................ 13 EXEMPTIONS FOR CERTAIN ASSOCIATES ...................................................................................................................................................................................... 14 BLACKOUT PERIOD FOR INVESTMENT PERSONS ......................................................................................................................................................................... 14 Special Provisions Applicable to Transactions in APAM Securities ........................................................................... 15 APAM BLACKOUT PERIODS ............................................................................................................................................................................................................ 15 TRANSACTIONS IN APAM SECURITIES SHOULD BE REPORTED TO COMPLIANCE WITHIN 24 HOURS ........................................................................ 15 SHORT SALES OF APAM SECURITIES PROHIBITED .................................................................................................................................................................... 15 HEDGING OF APAM SECURITIES PROHIBITED ............................................................................................................................................................................ 15 RESTRICTIONS ON HOLDING APAM SECURITIES IN MARGIN ACCOUNTS .......................................................................................................................... 16 RISKS OF HOLDING APAM SECURITIES IN DISCRETIONARY ACCOUNTS ............................................................................................................................. 16 RESTRICTIONS ON PLEDGING OF APAM SECURITIES ............................................................................................................................................................... 16 TRANSFER OF APAM SECURITIES BETWEEN BROKERAGE ACCOUNTS ................................................................................................................................. 16 ADDITIONAL RESTRICTIONS AND OBLIGATIONS APPLICABLE TO APAM’S EXECUTIVE OFFICERS ................................................................................ 16 PRECLEARANCE AND BLACKOUT PERIOD EXEMPTION FOR APPROVED 10B5-1 PLAN ................................................................................................... 16 Prohibited and Restricted Activities ................................................................................................................................. 17 INSIDER TRADING PROHIBITED ........................................................................................................................................................................................................ 17 RESTRICTIONS ON COMMUNICATION OF NON-PUBLIC INFORMATION ................................................................................................................................ 19 TRANSACTIONS IN SECURITIES ON APPLICABLE RESTRICTED LIST(S) PROHIBITED ............................................................................................................. 19 RESTRICTIONS ON CERTAIN TRANSACTIONS WITH CLIENTS .................................................................................................................................................... 19 APPROVAL REQUIRED FOR PARTICIPATION IN INITIAL PUBLIC OFFERINGS .......................................................................................................................... 19 APPROVAL REQUIRED FOR PARTICIPATION IN PRIVATE PLACEMENTS .................................................................................................................................. 20 LIMITATIONS ON INVESTMENTS IN PUBLICLY TRADED COMPANIES ...................................................................................................................................... 21 FRONT RUNNING PROHIBITED ......................................................................................................................................................................................................... 21 SPREAD BETTING PROHIBITED ......................................................................................................................................................................................................... 21 EXCESSIVE SHORT-TERM SECURITIES TRADING IN NON-EXEMPT SECURITIES IS PROHIBITED ........................................................................................ 21 HIGH-RISK TRADING ACTIVITIES ..................................................................................................................................................................................................... 21 PERSONAL SECURITIES TRANSACTIONS WITH CERTAIN BROKERS OR DEALERS PROHIBITED .......................................................................................... 21 Other Code Requirements .................................................................................................................................................. 22 AMENDMENTS TO THE CODE .......................................................................................................................................................................................................... 22 REGULATORY CONDUCT DISCLOSURE .......................................................................................................................................................................................... 22 CHANGES IN IMMEDIATE FAMILY MEMBER EMPLOYMENT ...................................................................................................................................................... 22 SERVICE AS A BOARD DIRECTOR, BOARD MEMBER, MANAGER, MANAGING MEMBER OR TRUSTEE ........................................................................... 22 OUTSIDE FINANCIAL INTERESTS AND OUTSIDE BUSINESS ACTIVITIES .................................................................................................................................. 22 Requirement to Preserve Confidentiality........................................................................................................................ 23 Enforcement of the Code and Consequences for Failure to Comply ........................................................................ 23 Individual Exemptions ........................................................................................................................................................ 24

Code of Ethics and Insider Trading Policy 1 Other Relevant Policies Although not formally part of this Code, Artisan Partners and its affiliates maintain a number of policies and procedures governing associate conduct. These include, among others: o Artisan Partners Policy on Gifts & Business Entertainment o Artisan Partners Pay to Play Policy o The APAM Code of Business Conduct o The APAM and Artisan Partners Funds Whistleblower Policies o The Artisan Partners Information Barrier Policy These policies and procedures may be accessed through the Artisan Partners Policy Portal Quick Access Guide ■ Definitions ■ Reporting and Preclearance Chart ■ FIS ECM Application ■ APAM Blackout Period Calendar

Code of Ethics and Insider Trading Policy 2 Code of Ethics at a Glance The Artisan Partners Code of Ethics and Insider Trading Policy (the “Code”) applies to you as a Covered Person of Artisan Partners. The Code governs your personal securities transactions, as well as those of your Immediate Family Members, as described in greater detail below. The Code has been designed to ensure compliance with the applicable federal securities laws and to protect the interests of our Clients. Abiding by the letter and the spirit of its terms is essential to your continued and future success at Artisan Partners. Key Provisions of the Code Associates are required to: ■ Behave consistently with Artisan Partners’ fiduciary obligations by putting Client interests first ■ Comply with applicable law, including the federal securities laws ■ Periodically review and then acknowledge that you understand and have complied with the Code ■ Preclear and disclose your personal securities transactions and those of your Immediate Family Members o Disclose all covered accounts and all holdings in covered securities o Preclear and disclose transactions in covered securities o Obtain Compliance approval before: Investing in private securities and IPOs or Acquiring more than 5% of a public company. ■ Report all transactions in APAM securities to Compliance within 24 hours ■ Preclear and report certain outside activities, such as serving on the board of a business organization ■ Report potential Code errors or exceptions under the Code to Compliance Prohibitions include but are not limited to the following: ■ Insider Trading ■ Communication of non-public information in violation of a duty of confidentiality ■ Front-running Client trades, or taking inappropriate advantage of Client information ■ Personal securities transactions conducted through undisclosed brokerage or investment accounts ■ Transactions in restricted securities, including APAM stock, during a blackout period ■ Certain other APAM transactions, including: short sales, hedging and pledging on margin ■ Transactions with Clients, except as approved by Compliance

Code of Ethics and Insider Trading Policy 3 Definitions Beneficial Interest or Ownership Your or your Immediate Family member’s direct or indirect opportunity to profit or share in any profit derived from a transaction in a security. In general, the definition of “beneficial ownership” under section 16 of the Securities Exchange Act of 1934 will be applied to determine if you have a beneficial interest in a security. Chief Compliance Officer Person(s) designated by Artisan Partners Limited Partnership, Artisan Partners UK LLP, Artisan Partners Funds and/or Artisan Partners Distributors to fill the role for each entity. References to the Chief Compliance Officer also include, for any function, any person designated by the Chief Compliance Officer as having responsibility for that function subject to the Chief Compliance Officer’s supervision. Reports relating to the Personal Securities Transactions of the Chief Compliance Officer shall be delivered to another member of the Compliance Team or to the Chief Legal Officer of the firm. The Chief Compliance Officer or another person to whom authority to approve Personal Securities Transactions has been granted under the Code may not approve his or her own Personal Securities Transactions; such transactions must be approved by someone else with such authority. Chief Legal Officer Person as is designated by Artisan Partners Asset Management. References to the Chief Legal Officer also include, for any function, any person designated by the Chief Legal Officer as having responsibility for that function and subject to the Chief Legal Officer’s supervision. Control You have “Control” or “Investment Control” over a security or an account if you have, directly or indirectly, the ability to engage in a transaction in the security/account or the ability to direct that a transaction occur in a security/account. You may be deemed to have investment control over a security even if you do not have a beneficial interest in the security. Examples of investment control include a person acting as an executor or personal representative of an estate or a person who has investment discretion, but does not include accounts you manage in connection with your Artisan Partners employment. Covered Person officers, employees, and partners of Artisan Partners Asset Management Inc. (APAM) and its affiliates including, without limitation, Artisan Partners Limited Partnership (Artisan US), Artisan Partners UK LLP (APUK), Artisan Partners Hong Kong Limited, Artisan Partners Asia-Pacific PTE, Ltd., Artisan Partners Australia Pty Ltd, APEL Financial Distribution Services Limited (AP Europe), and Artisan Partners Distributors LLC (collectively Artisan Partners); interested directors of Artisan Partners Funds, Inc. (Artisan Funds) and Artisan Partners Global Funds plc (Artisan Global Funds) who are not otherwise subject to another code of ethics adopted by Artisan Funds or Artisan Global Funds; and certain persons identified by Compliance who are under contract with and regularly working on the premises of Artisan Partners (such as a temporary

Code of Ethics and Insider Trading Policy 4 employee, independent contractor, or consultant). Discretionary Account An account of any Covered Person, held either alone or with others, over which a person (such as an investment adviser or trustee) who is not the Covered Person or an Immediate Family Member exercises investment discretion. Exempt Securities Securities that have been identified as exempt from reporting by Artisan Partners. Exempt Securities are: (i) securities that are direct obligations of the U.S. government (e.g., treasury bills, treasury notes and treasury bonds); (ii) shares of U.S. open-end mutual funds that are not Clients; (iii) interests in certain unit trusts, open-ended investment companies, and unit-linked life and pension interests held through the APUK or AP Europe pension plans to the extent these securities have been identified as exempt from reporting by the Compliance team; (iv) bank certificates of deposit, banker’s acceptances, repurchase agreements or commercial paper; and (v) commodities and commodity futures. Federal Securities Laws “Federal Securities Laws” means the Securities Act of 1933, the Securities Exchange Act of 1934, the Sarbanes-Oxley Act of 2002, the Investment Company Act of 1940, the Investment Advisers Act of 1940, Title V of the Gramm-Leach-Bliley Act, any rules adopted by the Securities and Exchange Commission under any of these statutes, the Bank Secrecy Act as it applies to mutual funds, and any rules adopted thereunder by the Securities and Exchange Commission or the Department of the Treasury. Immediate Family Members Includes all family members who share the same household, including but not limited to, a domestic partner, spouse, son, or daughter (including a legally adopted child, foster child or child who is a tax dependent), stepson or stepdaughter, son-in-law, daughter-in- law, parent, grandparent, stepfather or stepmother, mother-in-law or father-in-law, and siblings or siblings-in-law, or any descendants of any of the foregoing persons. For the avoidance of doubt, dependent children living part of the year away at school (e.g. boarding secondary school or undergraduate college or university), are considered household members. Investment Person Covered Person who is a portfolio manager, analyst, research associate, research assistant, trader, or any other Covered Person in a similar capacity who provides information, research analysis, or advice with respect to the purchase or sale of securities. Non-exempt Securities Any security type not specifically defined as an Exempt Security.

Code of Ethics and Insider Trading Policy 5 Personal Securities Transaction A transaction in a reportable security (including the "gifting" of a security) in which the Covered Person has beneficial interest or over which the Covered Person has Investment Control. Private Placement Offering of securities in which the issuer relies on an exemption from the registration provisions of the U.S. federal securities laws or comparable non-U. S. regulatory scheme, and usually involves a limited number of sophisticated investors and a restriction on resale of the securities. Examples are private investments in public equity securities (PIPES), hedge funds, private funds, “crowdfunding” investments, private funds, private partnerships or limited liability companies, Initial Coin Offerings, offerings of security tokens and similar investments or transactions. Reportable Accounts Any brokerage or other investment account in which you or an Immediate Family Member have a Beneficial Interest or Investment Control and which holds or could hold a security subject to reporting under the Code.

Code of Ethics and Insider Trading Policy 6 Fiduciary Duty to Clients and Related Principles Artisan Partners owes a fiduciary duty to Artisan Partners’ clients (“Clients”). This duty requires Artisan Partners and each Covered Person to seek to avoid or mitigate any conflict, or the appearance of a conflict, between the interests of a Client and the interests of Artisan Partners or a Covered Person. Covered Persons must at all times adhere to the following standards of conduct: ■ Clients Come First—The interests of Clients must always come first, as Clients deserve Artisan Partners’ undivided loyalty and unbiased effort. All Covered Persons must recognize and respect the interests of Clients, particularly with regard to their personal investment activities and any potential conflict with Client interests that may arise in connection with such activities. Covered Persons must not conduct a personal securities transaction in a manner that interferes with Client transactions. Covered Persons must not take inappropriate advantage of their positions and access to information that comes with such positions. Covered Persons should not seek to influence Client investments based on personal interests. ■ Compliance with Applicable Law—Covered Persons must comply with all applicable laws and regulations, including the Federal Securities Laws and the applicable laws of any country in which Artisan Partners operates. ■ Observe the Spirit of the Code—Artisan Partners expects that Covered Persons will comply with not only the letter but also the spirit of the Code and strive to avoid even the appearance of impropriety. Covered Persons should promptly notify Compliance if there is any reason to believe that an error or exception under the Code has occurred or is about to occur. Covered Persons Under the Code of Ethics Except as specifically noted, each Covered Person is subject to the requirements of the Code. Certain employees or contractors of Artisan Partners may be specifically identified by Compliance as Exempt Persons based on the nature of that person’s role and access to information (e.g., temporary consultants without access to Client or non-public trading and holdings information). An Exempt Person will be specifically notified of their exempt status by Compliance. Exempt Persons are exempt from certain provisions of the Code, but are required to adhere to the following Code requirements: Standards of Business Conduct, Restrictions on Communications of Non-public Information, Insider Trading Policy and the Requirement to Confidentiality. Disclosure and Certification Requirements As a Covered Person, you are subject to a variety of disclosure and certification requirements as noted below. Covered Persons are required to maintain brokerage and investment accounts with firms that provide an electronic APAM Code of Business Conduct All associates must: ■ Act with integrity, including being honest and candid, while maintaining the confidentiality of information where required or consistent with the Company’s policies; ■ Observe both the form and spirit of laws, rules, regulations, accounting standards and Company policies; and ■ Adhere to a high standard of professional ethics.

Code of Ethics and Insider Trading Policy 7 data feed. Covered Persons have 90 days from date of hire to move any accounts that do not offer an electronic data feed to a firm that offers an electronic data feed. Investment accounts for Covered Persons hired and established prior to the date of this Code are grandfathered into this electronic data feed requirement, but any new accounts established after the date of this Code must be maintained with firms that provide an electronic data feed. At the discretion of Compliance, Covered Persons may be permitted to maintain accounts with brokerage firms that do not offer an electronic data feed. Initial Disclosure of Accounts, Holdings and Certifications No later than 10 days after hire or of otherwise becoming a Covered Person, you must: ■ Disclose Your Reportable Accounts—identify to Artisan Partners each of your Reportable Accounts. ■ Disclose Your Holdings— disclose all your personal holdings of securities that are Non-exempt Securities. All the information you report must be no more than 45 days old. Artisan Partners Funds, Artisan Partners Global Funds, Artisan Partners collective investment trusts, Artisan Partners private funds and other funds that are Clients of Artisan Partners are Non-exempt Securities and are required to be reported. ■ Complete Certain Other Forms and Certifications, including but not limited to, the following: o an acknowledgement of receipt of this Code, the APAM Code of Business Code, and each other policy that Artisan Partners asks you to acknowledge; o disclosures regarding your outside business activity; o disclosures regarding your Immediate Family Members, including if an Immediate Family Member is employed by an investment adviser or securities broker-dealer or is employed by any company that he or she knows does business, or is actively seeking to do business, with Artisan Partners; and o a regulatory conduct disclosure questionnaire. Annual Disclosure of Accounts, Holdings and Certifications On an annual basis, Covered Persons are required to disclose to Compliance: (i) each Reportable Account; and (ii) Non-exempt Securities. Such information should be in the form requested by Compliance and must be current as of a date no more than 45 days before the report is submitted. Covered Persons need not provide annual disclosures regarding the following types of securities: ■ Holdings of Exempt Securities. ■ Securities held directly in an Artisan Partners Funds, Artisan Partners Global Funds, Artisan collective investment trust Am I required to report accounts over which neither I nor an Immediate Family Member exercise investment control, such as a blind trust or managed account? Yes, you should report to us known accounts over which you or your Immediate Family Member are beneficial owners, even if you exercise no direct or indirect influence or control over it. Compliance may determine that reporting of securities transactions is not required if you affirm that you have no direct or influence on investment decisions and have no knowledge of proposed transactions in the account. How do I submit my initial disclosure forms and certifications? Initial disclosure forms and certifications are generally submitted electronically through FIS Employee Compliance Manager (ECM). Artisan Partners Associates may access ECM through the following link: FIS ECM. For questions or assistance, please call the Code of Ethics hotline.

Code of Ethics and Insider Trading Policy 8 and Artisan Private Funds account because records for these accounts are maintained in Artisan Partners’ systems. You must disclose your interest in the account itself. Covered Persons are also required to complete other forms and certifications annually, including but not limited to, the following: ■ an acknowledgement of receipt of this Code, the APAM Code of Business Conduct, and each other policy that Artisan Partners asks you to acknowledge; ■ disclosures regarding your outside business activity; ■ disclosures regarding your Immediate Family Members, including if an Immediate Family Member is employed by an investment adviser or securities broker-dealer or is employed by any company that he or she knows does business, or is actively seeking to do business, with Artisan Partners; and a regulatory conduct disclosure questionnaire. Quarterly Transaction Disclosures Covered Persons must disclose all Personal Securities Transactions during a calendar quarter to Compliance no later than thirty days after the end of the quarter. The disclosure must contain all information required in the form requested by Compliance, including name of the broker, as-of date of the transaction, nature of the trade (e.g., purchase or sell), and as applicable, the ticker or CUSIP, interest rate, maturity date, number of shares, and principal amount of each Non-exempt Security. To the extent possible, this disclosure should be in the form of (i) duplicate confirmations or duplicate statements delivered directly to Artisan Partners by the broker or (ii) transactional data provided by the broker through a confirmed electronic feed. In the event the broker or custodian does not furnish duplicates or an electronic feed, or for a Covered Person that is a temporary employee whose anticipated period of continuous employment will not exceed four months, the Covered Person may be permitted, at the discretion of Compliance, to submit copies in the form requested by Compliance. Covered Persons need not provide quarterly disclosures regarding the following security and transaction types: ■ Transactions in Exempt Securities ■ Automatic Investment Plans (AIP). Automatic securities transactions, other than transactions in securities issued by APAM, in which regular periodic purchases (or withdrawals) are made in (or from) an investment account on a predetermined schedule and allocation. An automatic investment plan includes an issuer’s dividend reinvestment plan (DRP) and the automatic reinvestment of dividends or income occurring in an investment account. Note the following: o Establishment of such an AIP and sales of securities acquired through an AIP must be precleared, o Reportable securities transactions conducted through an AIP are exempt from quarterly transaction reporting but must be included in initial and annual holdings reporting. Am I required to provide a quarterly report if my broker provides duplicate statements? No. In most cases, confirmations or statements are sufficient and separate quarterly reports are not required.

Code of Ethics and Insider Trading Policy 9 ■ Artisan Partners Funds, Artisan Partners Global Funds, Artisan Partners collective investment trusts and Artisan Partners private fund accounts held directly with the product’s administrator or custodian. Conducting Personal Securities Transactions Personal Securities Transactions must be executed only through brokerage or other accounts that have been identified to Compliance. Except as provided below, all Personal Securities Transactions must be cleared in advance by Compliance. When in doubt as to whether a particular transaction requires preclearance, you should preclear the transaction or seek clarification from Compliance before placing a trade. No Covered Person may preclear his/her own Personal Securities Transaction, or engage, directly or indirectly in any transaction on the basis of material non-public information. In the case of certain transactions in APAM securities, Compliance will seek preclearance of the transaction from the Chief Legal Officer. Personal Securities Transactions of a Covered Person are generally cleared if: ■ the security is not on an applicable restricted list; ■ there is no related order pending in that security; ■ the preclearance request otherwise complies with other relevant provisions of the Code; and ■ the proposed transaction is not during a Blackout Period, as discussed below. Notwithstanding the above, Compliance may approve a Personal Securities Transaction in circumstances in which it has determined there is no conflict even though a related order is present. A related order is any order for the same or similar security (or an option on or warrant for that security) that is pending in an Artisan Partners’ trade order management system on behalf of a Client. Preclearance requests may also be denied at the sole discretion of the Compliance team even if the conditions described above apply. If a precleared transaction is not executed by the end of the second business day following the date on which preclearance is granted, the preclearance will expire and the request must be made again, unless otherwise notified by Compliance. Am I required to report new brokerage and investment accounts? Yes, notify Compliance promptly (generally within 30 days of calendar quarter end) of the opening of a new brokerage or investment account for yourself or Immediate Family Members. Do not assume your broker will proactively link the account or send duplicate statements. New brokerage or investment accounts must be opened with a feed broker. A list of “Brokers with Feeds” can be found on PTA in the Documents section. If an application form asks if you are associated with a broker-dealer or FINRA member firm, choose “yes”. Contact Compliance if an authorization letter from Artisan Partners is required to open the account.

Code of Ethics and Insider Trading Policy 10 The “gifting” of securities by a Covered Person is considered a Personal Securities Transaction of the Covered Person and is subject to preclearance as described above. For non-APAM securities, approval for gifting will typically be given unless the security is on an applicable restricted list. How do I preclear a Personal Securities Transaction? ■ Access FIS Employee Compliance Manager (ECM) ■ Enter the details of the proposed transaction and submit the request. Each security must be entered separately. ■ Don’t execute the trade until you receive a subsequent ECM-generated approval e-mail for each individual preclearance request. ■ Check the details of your approval and make sure your order is for the same security and direction as the approval you received. ■ Only execute your trade during the approval window (the day of approval plus the following two business days unless otherwise notified by Compliance).

Code of Ethics and Insider Trading Policy 11 Code of Ethics Reporting and Preclearance Chart Investment persons may have additional team-specific reporting and preclearance requirements. Contact the Code of Ethics Team regarding security types not named below or with any questions. S E C U R I T Y T Y P E R E P O R T A B L E P R E C L E A R A N C E R E Q U I R E D Pooled Vehicles Artisan Partners Funds Yes No Artisan Partners Global Funds Yes No Artisan private funds Yes No Artisan collective investment trusts Yes No Artisan client sub-advised funds Yes No U.S. mutual funds not noted above No No Non-U.S. registered funds1 Yes No Single stock ETFs, ETNs, and ETPs Yes Yes Index ETFs Yes No Hedge funds, private equity funds, venture capital funds and other nonaffiliated private funds Yes Yes Equities APAM securities Yes Yes Common, preferred, and convertible stock Yes Yes IPOs Yes, Contact Compliance Yes, Contact Compliance Private investments, private placements Yes Yes Non-Artisan employer stock/fund/options Yes Yes Fixed Income/Bonds Corporate bonds Yes Yes Municipal securities No No U.S. government agency issues Yes No

Code of Ethics and Insider Trading Policy 12 SECURITY TYPE REPORTABLE PRECLEARANCE REQUIRED Direct obligations of the U.S. Government (i.e., T-bills, T-notes, T-bonds, Treasury Strips) No No Options Options on non-exempt securities Yes Yes Options on exempt securities except index ETFs No No Options on index ETFs Yes No Options on commodities No No Options on currency Yes No Additional Activities and Security Types Automatic investment plan (AIP) initiation on a Non-exempt Security Yes Yes Discretionary or managed account securities trades Contact Compliance2 No3 529 plans (no Artisan Partners advised or sub- advised funds held) No No 529 plans (Artisan Partners advised or sub- advised funds held) Yes No Index-Linked Structured Products Index-linked structured products (as defined below)4 Yes No Crypto Assets Cryptocurrency (Bitcoin, Ethereum, etc.) No No Cryptocurrency ETFs (e.g. BTC, IBIT and ETH) Yes No Other crypto assets (fractionalized or tokenized digital assets,, unit trusts, initial coin offerings, etc.)5 Yes No Commodities Commodities No No Futures Security futures Yes Yes

Code of Ethics and Insider Trading Policy 13 1 Non-US registered funds are professionally managed pooled investment vehicles that are registered in a country outside the US and are typically only available to non-U.S. citizens. 2A copy of the discretionary managed account agreement or a letter from your adviser (on the firm’s letterhead) indicating that the firm’s has full discretionary authority to execute trades in the account/s will be required. 3The preclearance exemption for discretionary accounts is based upon the Covered Person not directing any investments in the account nor having knowledge of any transaction prior to execution. 4Structured products or derivative instruments (e.g. an equity-linked note) in which the reference asset is an index or is otherwise an asset listed in this table that does not require preclearance. Contact Compliance with product-specific questions. 5Regulators are sorting out the status of crypto currencies, tokens and other crypto assets and it is currently uncertain whether certain of those assets are considered securities. Crypto currency vehicles deemed to be securities require reporting, including initial coin offerings, fractionalized or tokenized digital assets, and vehicles designed to track the performance of a crypto currency. Preclearance and reporting is not currently required for transactions conducted directly in crypto currencies such as Bitcoin and Ethereum. If you are transacting in a crypto asset and you are uncertain whether it would be considered a security, we encourage you to contact the Compliance team for guidance in determining reporting requirements. 6Investment personnel may require portfolio manager approval of currency transactions in non-developed markets. Preclearance Exemptions for Certain Security Types You are not required to preclear securities in any of the following types of transactions (even if the security itself is not exempt from preclearance): ■ Purchases and sales of securities that are non-volitional on the part of the Covered Person or Immediate Family Member, including: o purchases or sales upon the exercise of puts or calls written by such person where the purchase or sale is effected based on the terms of the option and without action by the Covered Person or his or her agent (note: the writing of the option must be precleared); and o acquisitions or dispositions of securities through stock splits, reverse stock splits, mergers, consolidations, spin- offs, or other similar corporate reorganizations or distributions generally applicable to all holders of the same class of securities. ■ A transaction in a Discretionary Account if the Covered Person: o has previously identified the Discretionary Account to Compliance; o will not directly nor indirectly influence or control any particular transaction in the account; o has affirmed that he or she will not know of proposed transactions in that account until after they are executed; and o does not, in fact, know of the proposed transactions in that account until after the transaction has been executed. ■ Sales as a result of a tender offer made available generally to all shareholders of the issuer. SECURITY TYPE REPORTABLE PRECLEARANCE REQUIRED Currency futures Yes No Commodity futures No No Currencies Currencies6 No No

Code of Ethics and Insider Trading Policy 14 ■ Transactions in securities held for the benefit of a Covered Person in an employee benefit plan account maintained by the Covered Person’s prior employer in order to facilitate a transfer of the account to the Covered Person’s Artisan Partners’ 401(k) plan account or a rollover of the account to an IRA or other retirement account. ■ Purchases affected upon the exercise of rights issued by an issuer pro rata to all holders of a class of securities to the extent such rights were acquired from such issuer, and sales of such rights so acquired. ■ Transactions in Artisan Partners Funds, Artisan Partners Global Funds, Artisan collective investment trusts or Artisan private funds accounts directly held with the product’s respective administrator or custodian. ■ Under certain circumstances involving instances in which an Immediate Family Member receives or is offered an opportunity to acquire an equity interest in that person’s employer or an affiliate as the result of a bona fide employment relationship and not because of a Covered Person’s relationship with Artisan Partners or Clients. The following principles apply: o Transactions that are initiated by the employer of the Immediate Family Member (for example, provided as part of the Immediate Family Member’s compensation) are exempt from preclearance. o Transactions that are initiated by the Immediate Family Member must be precleared in advance. o Even if an Immediate Family Member’s acquisition of a security was exempt from preclearance, preclearance will be required for any sale of the security initiated by the Immediate Family Member. Exemptions for Certain Associates Associates on leave may be exempted from preclearance requirements at the discretion of the Compliance team with reference to the facts and circumstances surrounding the leave, including access to firm systems. An associate on leave will be contacted directly by the Compliance team to discuss the associate’s preclearance responsibilities. Blackout Period for Investment Persons For a preclearance request from an Investment Person, the Compliance team may contact a portfolio manager, or their designee, of the corresponding strategy for which the Investment Person works, (or may otherwise utilize information provided by such portfolio manager or designee), to determine if a transaction in the security subject to the proposed Personal Securities Transaction is actively under consideration for the strategy. If a portfolio manager requests preclearance of a Personal Securities Transaction, Compliance may contact another portfolio manager, or a designee, for the strategy or may otherwise utilize information provided by the portfolio manager or designee, to determine if a transaction in the security is actively under consideration for the strategy. For each proposed trade, the person responsible for reviewing such trade will be provided with information necessary to determine whether the trade may be approved consistent with the Code (e.g., title of the security, nature of the transaction, approximate number of shares involved in the transaction). An Investment Person may not purchase or sell a security when the proposed transaction would conflict with trading Do I need to preclear a transaction in a Discretionary Account if I acquire prior knowledge on a “one-off” basis? Yes, contact Compliance directly to complete the preclearance request. The preclearance exemption for Discretionary Accounts is based upon the Covered Person not having actual knowledge of any transaction until after that transaction is executed. Therefore, if a Covered Person becomes aware of any transaction in a discretionary account before it is executed, the person must seek preclearance of that transaction (if preclearance of the transaction would otherwise be required).

Code of Ethics and Insider Trading Policy 15 activity under consideration for a Client whose account is managed in an investment strategy for which such Investment Person provides research, trading or portfolio management services. The existence of such a “Blackout Period” will generally be determined in reference to information available through the firm’s order management systems, or in consultation with portfolio management as described above. Special Provisions Applicable to Transactions in APAM Securities APAM Blackout Periods All Covered Persons will be subject to a Quarterly Blackout Period during which time no transactions in APAM securities may be effected. The Quarterly Blackout Period will begin on the first day of each fiscal quarter for all Covered Persons except APAM Designees (as defined below). The Quarterly Blackout period will begin on the 15th day of the last month of the preceding fiscal quarter for APAM’s executive officers and certain other associates designated by the Chief Legal Officer (the “APAM Designees”). The Quarterly Blackout Period will continue until the opening of regular session trading on the New York Stock Exchange on the second trading day after the day on which APAM releases its earnings for that fiscal period. The Chief Legal Officer may modify the dates on which the Quarterly Blackout Period begins and ends with respect to a specific quarter for either all or some portion of Covered Persons, in their discretion. The Chief Legal Officer may designate additional blackout periods, or Special Blackout Periods, and may determine which associates are subject to a Special Blackout Period, in each case in their discretion from time to time. Covered Persons that are subject to a Special Blackout Period will be notified. No Covered Person subject to a Special Blackout Period may disclose to any other person that any Special Blackout Period has been designated. No transaction in APAM securities by a Covered Person, even if it has been precleared, may be effected during a Firmwide Blackout Period absent a waiver from the Chief Legal Officer. Waivers may be granted to specified Covered Persons on an ad hoc basis or made applicable to all Covered Persons as a blanket waiver. Transactions in APAM Securities Should Be Reported to Compliance within 24 Hours Personal Securities Transactions in APAM securities should be reported to Compliance within 24 hours. Short Sales of APAM Securities Prohibited Covered Persons may not, directly or indirectly, sell any APAM equity security short (that is, sell an APAM equity security when the Covered Person does not own it), or sell short against the box (that is, sell an APAM equity security when the Covered Person owns the security sold but does not deliver it). Hedging of APAM Securities Prohibited Covered Persons may not hedge their exposure to the economic consequences of ownership of APAM securities. For the avoidance of doubt, ownership of equity interests in a subsidiary or affiliate of Artisan Partners is not prohibited by the Code. How do I know whether I am considered an APAM Designee? The Legal or Compliance team will notify all associates who are APAM designees. You can also contact the Code of Ethics hotline with any questions.

Code of Ethics and Insider Trading Policy 16 Restrictions on Holding APAM Securities in Margin Accounts APAM securities may only be held in a margin account with the prior approval of the Chief Legal Officer, who may place additional restrictions on the holding. Risks of Holding APAM Securities in Discretionary Accounts The special Code requirements applicable to transactions in APAM securities apply to all accounts, even if APAM securities are held in Discretionary Accounts. A financial advisor managing a Discretionary Account cannot trade APAM securities on behalf of a Covered Person during a Blackout Period. As a result, and in order to minimize the risk of Code violations, Covered Persons are strongly discouraged from holding APAM securities in a Discretionary Account. Restrictions on Pledging of APAM Securities Covered Persons may not pledge APAM securities when they are aware of material non-public information or otherwise are not permitted to trade in APAM securities. Transfer of APAM Securities between Brokerage Accounts In order to facilitate monitoring of transactions in APAM securities, Covered Persons should notify Compliance of their intent to transfer APAM securities from one brokerage account to another prior to initiating any such transfer. Details of the receiving account and the securities to be transferred can be provided to the Compliance team via e-mail to DL – Code of Ethics. Additional Restrictions and Obligations Applicable to APAM’s Executive Officers APAM’s executive officers for purposes of Section 16 of the Securities Exchange Act of 1934 are subject to additional requirements, including the obligation to promptly report certain transactions in APAM’s securities to the SEC. These officers are also subject to the “short-swing profit” provisions of Section 16(b), pursuant to which any profit realized from a purchase and sale, or sale and purchase, of any equity securities of APAM within a six-month period may be subject to clawback by Artisan Partners, unless an exemption applies. Preclearance and Blackout Period Exemption for Approved 10b5-1 Plan Preclearance and Blackout Periods for APAM Securities do not apply to transactions executed pursuant to a pre-existing written plan, contract or instruction under Rule 10b5-1 (an “Approved 10b5-1 Plan”) that: ■ has been reviewed and approved by the Chief Legal Officer at least ten days in advance of being entered into (or, if revised or amended, the revisions or amendments have been reviewed and approved by the Chief Legal Officer at least ten days in advance of being entered into); ■ provides that no trades may occur thereunder until the expiration of the applicable cooling-off period as specified in Rule 10b5-1(c)(ii)(B), and no trades occur until after that time. The required cooling-off period will apply to the entry into a new 10b5-1 plan and any revision or modification of a 10b5-1 plan; ■ was entered into in good faith by a Covered Person, and not as part of a plan or scheme to evade the prohibitions of How do I make sure my APAM transactions are reported to Compliance within 24 hours? For accounts established at Schwab through Human Capital in the context of an equity award, the Compliance team generally receives direct electronic trade confirmations that satisfy the 24- hour notification requirement. For all other accounts, the notification process depends on whether or not your broker has provided Compliance with an electronic feed of trade confirmations. If your broker has provided such a feed, you may generally rely on the confirmation to satisfy the notification requirement. If not, you must notify Compliance.

Code of Ethics and Insider Trading Policy 17 Rule 10b5-1, at a time when such person was not in possession of material non-public information about APAM and, if the Covered Person is a director or officer, the 10b5-1 plan must include representations by the Covered Person certifying to that effect; and; ■ either: (i) gives a third party the discretionary authority to execute purchases and sales of securities of APAM, outside the control of the Covered Person, so long as the third party does not possess any material non-public information about APAM; or (ii) explicitly specifies the security or securities to be purchased or sold, the number of shares, the prices and/or dates of transactions, or other formula(s) describing such transactions; ■ is the only outstanding Approved 10b5-1 Plan entered into by the Covered Person (subject to the exceptions set out in Rule 10b5-1(c)(ii)(D)). Please contact the Chief Legal Officer if you are considering entering into, modifying or terminating a 10b5-1 plan or have any questions regarding Rule 10b5-1 plans. Prohibited and Restricted Activities Insider Trading Prohibited You may not engage, directly or indirectly, in any transaction (either a Personal Securities Transaction or a transaction for a Client) involving the purchase or sale of any security, including any security issued by APAM, on the basis of “material,” “non-public” information. Please note that regulators have prosecuted individuals on a theory of “shadow trading”, which could include trading in the securities of one company (Company A) on the basis of non- public information that is specific to another company (Company B), but where the non-public information about Company B is material to the price of Company A’s securities. This could be as a result of the companies being competitors in the same industry or linked economically in some other way (e.g. supplier and manufacturer). Information is “material” if there is a substantial likelihood that a reasonable investor would consider it important in deciding whether to buy, hold or sell a security. Any information that could reasonably be expected to affect the price of the security is material. Material information can be positive or negative. Material information is not limited to facts but may also include projections and forecasts. Examples of potentially material information include, without limitation: ■ Quarterly and year-end earnings and significant changes in financial performance, outlook, or liquidity (including, in the case of APAM, levels of or changes in assets under management, cash flows and pipeline information); ■ Changes in debt ratings; ■ Projections that significantly differ from external expectations; ■ Stock splits, public or private securities offerings, or changes in dividend policies or amounts; ■ Significant developments involving corporate relationships; ■ Proposals, plans or agreements, even if preliminary in nature, of a pending or proposed merger, acquisition, divestiture, recapitalization, strategic alliance, licensing arrangement or purchase or sale of substantial assets; Are there any special considerations to keep in mind with respect to insider trading laws outside the U.S.? Yes. You should keep in mind that insider trading laws vary from country to country, and that local authorities can and do assert their jurisdiction over particular transactions regardless of where a buyer or seller of securities resides. Transactions in a U.K. listed security, for example, can be the basis for an action against a U.S. resident who trades on the basis of material non-public information.

Code of Ethics and Insider Trading Policy 18 ■ Actual or threatened major litigation or developments relating to the resolution of such litigation; ■ Events having a significant regulatory effect or involving significant regulatory intervention; ■ Events that may result in the creation of a significant reserve or write-off or other significant adjustment to a company’s financial statements; and ■ Significant changes in senior management. ■ Non-public information” is information that is not generally known or available to the public. The fact that information has been disclosed to a few members of the public does not make it public for insider trading purposes. Information becomes “public” when (i) it is disclosed in a way designed to achieve broad dissemination to the investing public generally, without favoring any special person or group, and (ii) there has been adequate time for the public to digest that information. Examples of broad dissemination include press releases, filings with the Securities and Exchange Commission and meetings, conference calls or webcasts that are open to the public. Non-public information may include, for example: ■ Information available to a select group of analysts or brokers or institutional investors; ■ Undisclosed facts that are the subject of rumors, even if the rumors are widely circulated; ■ Information that has been entrusted to a company or a person on a confidential basis until a public announcement of the information has been made and enough time has elapsed for the market to respond to a public announcement; or ■ Information obtained from alternative data sources (e.g., social media, credit card providers, geolocation services) under certain circumstances, particularly when there are questions around ownership rights in or consent with respect to use of the information. ■ Confidential information obtained from expert networks services that provide access to industry specialists, corporate executives, vendors, suppliers, physicians, consultants or analysts. Trading during a tender offer represents a particular concern in the law of insider trading. Each Covered Person should exercise particular caution if they become aware of non-public information relating to a tender offer. Artisan Partners does not currently utilize “value-add” investors as part of its business strategy; however, certain clients or investors in a fund sponsored by Artisan Partners may have material non-public information from time to time. In addition, directors of APAM and funds sponsored by Artisan Partners, principals or portfolio managers at other asset management firms, investment bankers, institutional investors, investment analysts, consultants, corporate executives, key persons or clients whose accounts are managed by Artisan Partners may be in possession of material non-public information regarding one or more public companies. Each Covered Person should avoid discussing non-public information about any such company with these persons. If a Covered Person should become aware of potentially What should I do if I inadvertently receive material non-public information? If you think that you might have inadvertently received material, non-public information from any source, you should take the following steps: ■ Report the information immediately to the Chief Legal Officer or to another attorney in Legal. ■ Do not purchase or sell any securities potentially impacted by the information on behalf of yourself or others, including Clients, until Artisan Partners has made a determination as to the need for trading restrictions. ■ Do not communicate the information inside or outside Artisan Partners (even to your manager) other than to the Chief Legal Officer or to another attorney in the Legal Department. After review of the issue, Artisan Partners will determine whether any trading restrictions apply and what action, if any, the firm should take.

Code of Ethics and Insider Trading Policy 19 material, non-public information regarding any such company, he or she should advise the Chief Legal Officer or another attorney in Legal. Restrictions on Communication of Non-public Information Under certain circumstances, Artisan Partners associates may receive non-public information concerning a current or potential investment opportunity. Such information may be subject to a confidentiality agreement and is also subject to the Artisan Partners’ Information Barrier Policy. No Covered/Exempt Person may communicate non-public information to others in violation of the law, any firm policy, or any duty of confidentiality owed to a third-party. Conversations containing such information, if appropriate at all, should be conducted in private. The “tipping” of material, non-public information to a third-party in violation of a duty of confidentiality raises special issues under the insider- trading laws, and is expressly prohibited under this Code. Simply recommending someone buy, sell or hold a security based on material non-public information could be considered “tipping”. Access to paper or electronic files containing non-public information should be restricted, including by maintenance of such materials in locked cabinets or through the use of passwords or other security devices for electronic data. Transactions in Securities on Applicable Restricted List(s) Prohibited From time to time, associates in the Company may come into possession of material non-public information about a particular company. The Compliance team may include each of these companies on one or more “restricted lists,” and impose restrictions on transactions involving securities of those companies in Client accounts and in the personal accounts of Covered Persons. The applicability of these restrictions may be firmwide, or may be limited to certain parts of the firm, taking into account the existence of our Information Barrier Policy. Covered Persons are prohibited from knowingly engaging in any transactions for their personal accounts or for the accounts of others, including Clients, that would be inconsistent with these restrictions. Restrictions on Certain Transactions with Clients No Covered Person should knowingly purchase from or sell to any Client any security or other property except securities issued by that Client, or except as approved by Compliance. This section does not prohibit purchases of Client products or services that are available to the general public. Approval Required for Participation in Initial Public Offerings No Covered Person is allowed to acquire any security in an initial public offering, except with the prior written approval of Compliance, based on a determination that: (i) the acquisition is consistent with applicable regulatory requirements, does not conflict with the purposes of the Code or its underlying policies, or the interests of Artisan Partners or its Clients; and (ii) the opportunity to acquire the security has been made available to the person for reasons other than the person’s relationship with Artisan Partners or its Clients. Such circumstances might include, for example: ■ an opportunity to acquire securities of an insurance company converting from a mutual ownership structure to a stockholder ownership structure, if the person’s ownership of an insurance policy issued by that company conveys How do I know if a particular company is included on an Artisan Partners Restricted List(s)? Compliance does not publish the contents of the Restricted List(s) because, under certain circumstances, the inclusion of a particular name could itself convey material non-public information. You should preclear all of your Personal Securities Transactions as required under the Code. Compliance uses the preclearance process to ensure that requests to trade securities of issuers on an applicable Restricted List are denied.

Code of Ethics and Insider Trading Policy 20 that opportunity; ■ an opportunity resulting from the person’s pre-existing ownership of an interest in the IPO company or an investor in the IPO company; or ■ an opportunity made available to the person’s Immediate Family Members sharing the same household, in circumstances permitting Compliance reasonably to determine that the opportunity is not being made available indirectly because of the person’s relationship with Artisan Partners or its Clients (for example, because of the Immediate Family Member’s employment). Approval Required for Participation in Private Placements Private Placements require express written prior approval of Compliance. Covered Persons may invest in private funds sponsored by Artisan Partners through the regular subscription process and need not seek separate prior approval from the Compliance team. In deciding whether that approval should be granted, Compliance may consider a number of relevant factors including, but not limited to: ■ whether the investment opportunity should be reserved for Clients; ■ whether the opportunity has been offered because of the person’s relationship with Artisan Partners or its Clients; ■ whether the investment is in a pooled vehicle or an operating company; ■ the size of the proposed investment in relation to the total offering and in relation to the total equity ownership of the entity in which the Covered Person seeks to invest; ■ the rights to be granted to the Covered Person as a result of the investment; ■ the amount of business involvement the Covered Person would have after the investment has been made; and ■ the degree to which the Covered Person may be deemed to have control over the entity after the investment has been made. Investment by a Covered Person in a private fund that is not managed by Artisan, requires prior approval by Compliance before making a commitment to the private fund. Further approval is not required each time a private fund draws on capital where the Covered Person's commitment was previously approved. Additional commitments by a Covered Person must be approved prior to making the additional commitment. A non-volitional sale of a Covered Person's investment in such a private fund (e.g., a sale due to a fund divestiture or liquidation) is not subject to prior approval. Volitional redemptions or sales by a Covered Person from a private fund are subject to prior approval by Compliance. Most private investments are not subject to quarterly transactions reporting; however, all private investments are My spouse’s employer has offered him/her a stake in their company, and the company is private. Is prior written approval required? The requirement to obtain written approval prior to the acquisition of a private placement does not apply to the acquisition by a Covered Person’s Immediate Family Member of an ownership interest in that person’s employer or an affiliate of the employer, provided that the acquisition is non-volitional and is the result of that person’s bona fide employment relationship and is not a result of a Covered Person’s relationship with Artisan Partners or Clients. Any volitional acquisitions, such as participation in an employer’s stock purchase plan, require prior approval by Compliance. All acquisitions require disclosure as part of the quarterly reporting process and the ownership interest should be disclosed as part of the initial and annual holdings reports. Subsequent dispositions of the interest are subject to preclearance.

Code of Ethics and Insider Trading Policy 21 subject to annual holdings reporting requirements. Limitations on Investments in Publicly Traded Companies No Covered Person may knowingly own more than 5% of a public company’s outstanding shares without prior written approval from Compliance. Front Running Prohibited Covered Persons are prohibited from inappropriately using proprietary or confidential information obtained while associated with Artisan Partners for their personal benefit. For example, no Covered Person may engage in a Personal Securities Transaction in a security based on advance knowledge that Artisan Partners is effecting or will be effecting a purchase or sale of the security on behalf of a Client. This prohibition will not affect the execution of transactions for the account of a Client in which one or more Covered Persons has an economic interest (such as, for example, where a Covered Person owns shares of an Artisan Fund), which may be executed by Artisan Partners’ traders in accordance with the Artisan Partners’ trading practices. Spread Betting Prohibited Covered Persons are prohibited from engaging in spread betting transactions based on securities that are subject to pre-clearance or prohibited under the Code. Excessive Short-Term Securities Trading in Non-Exempt Securities Is Prohibited Covered Persons are prohibited from engaging in the excessive short-term trading of Non-exempt Securities. The purchase and sale, or sale and purchase, of the same (or equivalent) securities within 30 calendar days are generally regarded as short-term trading. Preclearance requests in Non-exempt Securities that constitute short-term trading resulting in a profit will generally be denied by the Compliance team. Covered Persons are also strongly discouraged from engaging in the excessive short-term trading of certain Exempt Securities that are not intended for short-term trading or as otherwise deemed inappropriate by Compliance. Transactions that constitute such short-term trading may be subject to redemption fees by the issuer, escalation to management, additional Code training, permanent or temporary limitations or prohibitions on Personal Securities Transactions. High-Risk Trading Activities Certain high-risk trading activities, if used in the management of a Covered Person’s personal trading portfolio, are risky not only because of the nature of the securities transactions themselves, but also because of the potential that action necessary to close out the transactions may become prohibited during the duration of the transactions. Examples of such activities include short sales of common stock and trading in derivative instruments (including options). Covered Persons engage in such trading activities at their own risk. If Artisan Partners becomes aware of material, non- public information about the issuer of the underlying securities, or if preclearance of the closing transaction is denied, Artisan Partners personnel may find themselves “frozen” in a position. Artisan Partners will not bear any losses in personal accounts as a result of implementation of this policy. Personal Securities Transactions with Certain Brokers or Dealers Prohibited In order to comply with certain state regulations, Covered Persons are restricted from executing any Personal Securities Transactions with the institutional trading desks of any broker or dealer with whom Artisan Partners conducts business for its Clients.

Code of Ethics and Insider Trading Policy 22 Other Code Requirements Amendments to the Code Each time a Covered Person receives a copy of the Code, including any amendment, he or she is required to acknowledge receipt. Regulatory Conduct Disclosure Covered Persons have an ongoing obligation to promptly report to Compliance if anything occurs which would change any previously reported responses relating to the Covered Associates’ regulatory conduct disclosures. Changes in Immediate Family Member Employment Covered Persons have an ongoing obligation to promptly report to Compliance if an Immediate Family Member is employed by an investment adviser, a securities broker-dealer or an otherwise regulated financial services company (or associated with as an owner, proprietor, partner, officer, director, board member, agent or otherwise) or any company that does business with or is seeking to do business with Artisan Partners, Artisan Partners Funds or Artisan Partners Distributors. Service as a Board Director, Board Member, Manager, Managing Member or Trustee No Covered Person may serve as a member of the board of directors or trustees, an officer, a manager or a managing member or in a similar capacity exercising control of any business organization (including an advisory board) without the prior written approval of Compliance, unless the organization is a civic or charitable organization or an organization owned or controlled by a member of the Covered Person’s family. If a Covered Person is serving as a board member, officer, manager, managing member or in a similar control capacity of any organization, the Covered Person should be mindful of his or her responsibilities under the Code and his or her agreements with Artisan Partners, and should seek to avoid any appearance of impropriety. In particular, Covered Persons are reminded of their obligations not to misuse confidential information belonging to Artisan Partners or any Client. A Covered Person serving as a board member, officer, manager or managing member of an organization or in a similar control capacity is encouraged not to participate in any activity on behalf of the organization that could create an appearance of impropriety. In some circumstances, the service of a Covered Person as a board member of an organization or an executor, conservator or trustee for an estate, conservatorship or personal trust, could result in Artisan Partners being deemed to have custody of the assets of that entity, if it were a Client. Because Artisan Partners does not accept custody of Client assets, if Artisan Partners would be deemed to have custody because of the relationship of a Covered Person to the organization, the Covered Person may be required to give up his or her position as a condition of Artisan Partners accepting an engagement to provide advisory services. Outside Financial Interests and Outside Business Activities Covered Persons should avoid outside financial interests or outside business activities that may give rise to conflicts of interest with Clients or Artisan Partners or that may create divided loyalties, divert substantial amounts of their time, and/or compromise their independent judgment.

Code of Ethics and Insider Trading Policy 23 Prior to association with Artisan Partners, newly hired Covered Persons are required to disclose to Artisan Partners any outside financial interests or outside business activities that may present such a conflict of interest. Thereafter, Covered Persons must obtain Compliance approval prior to acquiring any such interests or engaging in any such activities. Covered Persons seeking such approval should contact the Compliance team or an attorney in the Legal Department. Covered Persons are prohibited from providing consulting services to non-Artisan entities for pay or on a voluntary basis, such as those offered through expert networks, without seeking prior approval from the Compliance team. Requirement to Preserve Confidentiality Each Covered/Exempt Person is required to keep confidential any information concerning Artisan Partners or its Clients that is not generally known to the public that is learned during the term of his or her employment or association with Artisan Partners, including, but not limited to, the following: ■ the investment strategies, processes, analyses, databases, and techniques relating to capital allocation, stock selection and trading used by the investment team or other investment professionals employed by Artisan Partners; ■ the identity of and all information concerning Clients and shareholders of Clients; ■ information prohibited from disclosure by a Client’s policy on release of portfolio holdings or similar policy; and ■ all other information that is determined by Artisan Partners or a Client to be confidential and proprietary and that is identified as such prior to or at the time of its disclosure to the Covered/Exempt Person. No Covered/Exempt Person is allowed to use confidential information for his or her own personal benefit or for the benefit of any third party, or directly or indirectly disclose such information, except to other associates of Artisan Partners, its affiliated businesses and third parties to whom disclosure is made pursuant to the performance of his or her duties as an associate of Artisan Partners or as otherwise may be required by law. In addition, nothing in this Code or any other Artisan Partners’ policy limits a Covered/Exempt Person’s ability to lawfully report a violation of applicable laws or regulations to an appropriate regulatory authority or otherwise communicate with an applicable regulatory authority in a manner protected by, and consistent with, the laws applicable to the Covered/Exempt Person. This obligation of confidentiality is in addition to any other Artisan Partners’ policies relating to confidentiality and confidentiality agreements with Artisan Partners to which a Covered/Exempt Person is a party. Enforcement of the Code and Consequences for Failure to Comply Compliance is responsible for promptly investigating all reports of possible errors or exceptions under this Code. Compliance with this Code is a condition of employment or association with Artisan Partners, status as a registered representative of Artisan Distributors, and retention of any position you hold with any funds sponsored by Artisan Partners. Taking into consideration all relevant circumstances, Artisan Partners will determine what action is appropriate for any error under or breach of the provisions of the Code. Possible actions include escalation to management, letter of warning, additional Code training, reversal or unwinding of trades, letters of sanction, disgorgement of profits, suspension or termination of employment, impact to a Covered Person’s compensation, removal from office, or permanent or temporary limitations or prohibitions on Personal Securities Transactions more What are some examples of outside interests that may give rise to a conflict? Examples of outside interests or activities that may give rise to a conflict of interest include where a Covered Person holds a substantial interest in a company that has dealings with Artisan Partners either on a recurring or “one-off” basis, or where a Covered Person has an employment relationship or position with a potential Client or vendor of Artisan Partners.

Code of Ethics and Insider Trading Policy 24 extensive than those generally applicable under the Code. Exceptions under the Code may be subject to Client reporting obligations. In addition, Artisan Partners may report conduct believed to violate the law or regulations applicable to Artisan Partners or the Covered Person to the appropriate regulatory authorities. Individual Exemptions There may be circumstances from time to time in which the application of this Code produces unfair or undesirable results or in which a proposed transaction is not inconsistent with the purposes of the Code. Therefore, the Chief Compliance Officer or a designee may grant an exemption from any provision of this Code, provided that the person granting the exemption based his or her determination to do so on the ground that the exempted transaction is not inconsistent with the purposes of this Code or any law or regulation applicable to Artisan Partners, and documents that determination in writing.
Exhibit 21.1
Subsidiaries of Artisan Partners Asset Management Inc. as of December 31, 2025 (1)
| Name | Jurisdiction of Incorporation/Organization | ||||||||||
| Artisan Partners Holdings LP | Delaware | ||||||||||
| Artisan Partners Distributors LLC | Wisconsin | ||||||||||
| Artisan Investments GP LLC | Delaware | ||||||||||
| Artisan Partners Limited Partnership | Delaware | ||||||||||
| Artisan Partners Asia-Pacific PTE Ltd. | Singapore | ||||||||||
| Artisan Partners Limited | United Kingdom | ||||||||||
| Artisan Partners II Limited | United Kingdom | ||||||||||
| Artisan Partners UK LLP | United Kingdom | ||||||||||
| Artisan Partners Services LLC | Delaware | ||||||||||
| Artisan Partners International Holdings LLC | Delaware | ||||||||||
| Artisan Partners Australia Pty Ltd. | Australia | ||||||||||
| Artisan Partners Europe Holdings LLC | Delaware | ||||||||||
| APEL Financial Distribution Services Ltd. | Ireland | ||||||||||
| Artisan Partners Hong Kong Holdings LLC | Delaware | ||||||||||
| Artisan Partners Hong Kong Limited | Hong Kong | ||||||||||
| Artisan Credit Opportunities GP LLC | Delaware | ||||||||||
| Credit Team Holdco LLC | Delaware | ||||||||||
| Antero Peak Group GP LLC | Delaware | ||||||||||
| Antero Peak Group Holdco LLC | Delaware | ||||||||||
| Artisan Partners GP LLC | Delaware | ||||||||||
Artisan International Explorer GP LLC | Delaware | ||||||||||
| International Explorer Holdco LLC | Delaware | ||||||||||
| Artisan Partners Asia Funds Holdco LLC | Delaware | ||||||||||
| Artisan Partners Asia Funds GP LLC | Delaware | ||||||||||
| Artisan Partners Cayman Holdings LLC | Cayman Islands | ||||||||||
| AP International/Global Value Opportunity GP LLC | Delaware | ||||||||||
| Artisan Dislocation Opportunities GP LLC | Delaware | ||||||||||
| Artisan Emerging Markets Local Opportunities GP LLC | Delaware | ||||||||||
| Artisan Global Special Situations GP LLC | Delaware | ||||||||||
| Artisan Global Special Situations Holdco LLC | Delaware | ||||||||||
| Artisan Franchise GP LLC | Delaware | ||||||||||
| Artisan Franchise Holdco LLC | Delaware | ||||||||||
| Artisan Global Equity Long/Short GP LLC | Delaware | ||||||||||
| Antero Peak Enhanced Equity GP LLC | Delaware | ||||||||||
(1) Other subsidiaries have been omitted because, when considered in the aggregate, they do not constitute a significant subsidiary.
Exhibit 23.1
CONSENT OF INDEPENDENT REGISTERED PUBLIC ACCOUNTING FIRM
We hereby consent to the incorporation by reference in the Registration Statements on Form S-3 (No. 333-194684) and Form S-8 (No.333-187180 and No. 333-272400) of Artisan Partners Asset Management Inc. of our report dated February 20, 2026 relating to the financial statements, and the effectiveness of internal control over financial reporting, which appears in this Form 10-K.
/s/ PricewaterhouseCoopers LLP
Chicago, Illinois
February 20, 2026
Exhibit 31.1
CERTIFICATION
I, Jason A. Gottlieb, certify that:
1. I have reviewed this report on Form 10-K of Artisan Partners Asset Management Inc.;
2. Based on my knowledge, this report does not contain any untrue statement of a material fact or omit to state a material fact necessary to make the statements made, in light of the circumstances under which such statements were made, not misleading with respect to the period covered by this report;
3. Based on my knowledge, the financial statements, and other financial information included in this report, fairly present in all material respects the financial condition, results of operations and cash flows of the registrant as of, and for, the periods presented in this report;
4. The registrant’s other certifying officer and I are responsible for establishing and maintaining disclosure controls and procedures (as defined in Exchange Act Rules 13a-15(e) and 15d-15(e)) and internal control over financial reporting (as defined in Exchange Act Rules 13a-15(f) and 15d-15(f)) for the registrant and have:
a. Designed such disclosure controls and procedures, or caused such disclosure controls and procedures to be designed under our supervision, to ensure that material information relating to the registrant, including its consolidated subsidiaries, is made known to us by others within those entities, particularly during the period in which this report is being prepared;
b. Designed such internal control over financial reporting, or caused such internal control over financial reporting to be designed under our supervision, to provide reasonable assurance regarding the reliability of financial reporting and preparation of financial statements for external purposes in accordance with generally accepted accounting principles;
c. Evaluated the effectiveness of the registrant’s disclosure controls and procedures and presented in this report our conclusions about the effectiveness of the disclosure controls and procedures, as of the end of the period covered by this report based on such evaluation; and
d. Disclosed in this report any change in the registrant’s internal control over financial reporting that occurred during the registrant’s most recent fiscal quarter (the registrant's fourth fiscal quarter in the case of an annual report) that has materially affected, or is reasonably likely to materially affect, the registrant’s internal control over financial reporting; and
5. The registrant’s other certifying officer and I have disclosed, based on our most recent evaluation of internal control over financial reporting, to the registrant’s auditors and the audit committee of the registrant’s board of directors (or persons performing the equivalent functions):
a. All significant deficiencies and material weaknesses in the design or operation of internal control over financial reporting which are reasonably likely to adversely affect the registrant’s ability to record, process, summarize and report financial information; and
b. Any fraud, whether or not material, that involves management or other employees who have a significant role in the registrant’s internal control over financial reporting.
| /s/ Jason A. Gottlieb | ||
Jason A. Gottlieb Chief Executive Officer and President (principal executive officer) | ||
Date: February 20, 2026
Exhibit 31.2
CERTIFICATION
I, Charles J. Daley, Jr., certify that:
1. I have reviewed this report on Form 10-K of Artisan Partners Asset Management Inc.;
2. Based on my knowledge, this report does not contain any untrue statement of a material fact or omit to state a material fact necessary to make the statements made, in light of the circumstances under which such statements were made, not misleading with respect to the period covered by this report;
3. Based on my knowledge, the financial statements, and other financial information included in this report, fairly present in all material respects the financial condition, results of operations and cash flows of the registrant as of, and for, the periods presented in this report;
4. The registrant’s other certifying officer and I are responsible for establishing and maintaining disclosure controls and procedures (as defined in Exchange Act Rules 13a-15(e) and 15d-15(e)) and internal control over financial reporting (as defined in Exchange Act Rules 13a-15(f) and 15d-15(f)) for the registrant and have:
a. Designed such disclosure controls and procedures, or caused such disclosure controls and procedures to be designed under our supervision, to ensure that material information relating to the registrant, including its consolidated subsidiaries, is made known to us by others within those entities, particularly during the period in which this report is being prepared;
b. Designed such internal control over financial reporting, or caused such internal control over financial reporting to be designed under our supervision, to provide reasonable assurance regarding the reliability of financial reporting and preparation of financial statements for external purposes in accordance with generally accepted accounting principles;
c. Evaluated the effectiveness of the registrant’s disclosure controls and procedures and presented in this report our conclusions about the effectiveness of the disclosure controls and procedures, as of the end of the period covered by this report based on such evaluation; and
d. Disclosed in this report any change in the registrant’s internal control over financial reporting that occurred during the registrant’s most recent fiscal quarter (the registrant's fourth fiscal quarter in the case of an annual report) that has materially affected, or is reasonably likely to materially affect, the registrant’s internal control over financial reporting; and
5. The registrant’s other certifying officer and I have disclosed, based on our most recent evaluation of internal control over financial reporting, to the registrant’s auditors and the audit committee of the registrant’s board of directors (or persons performing the equivalent functions):
a. All significant deficiencies and material weaknesses in the design or operation of internal control over financial reporting which are reasonably likely to adversely affect the registrant’s ability to record, process, summarize and report financial information; and
b. Any fraud, whether or not material, that involves management or other employees who have a significant role in the registrant’s internal control over financial reporting.
| /s/ Charles J. Daley, Jr. | ||
Charles J. Daley, Jr. Executive Vice President, Chief Financial Officer and Treasurer (principal financial officer) | ||
Date: February 20, 2026
Exhibit 32.1
CERTIFICATION PURSUANT TO
18 U.S.C. SECTION 1350, AS ADOPTED PURSUANT TO SECTION 906 OF THE SARBANES-OXLEY ACT OF 2002
I, Jason A. Gottlieb, the Chief Executive Officer of Artisan Partners Asset Management Inc. (the “Company”), hereby certify, pursuant to 18 U.S.C. Section 1350, as adopted pursuant to Section 906 of the Sarbanes-Oxley Act of 2002, that, to my knowledge:
• The Annual Report on Form 10-K of the Company for the annual period ended December 31, 2025 as filed with the Securities and Exchange Commission on the date hereof (the “Form 10-K”), fully complies with the requirements of Section 13(a) or 15(d) of the Securities Exchange Act of 1934, as amended; and
• The information contained in the Form 10-K fairly presents, in all material respects, the financial condition and results of operations of the Company.
| /s/ Jason A. Gottlieb | ||
Jason A. Gottlieb Chief Executive Officer and President (principal executive officer) | ||
Date: February 20, 2026
Exhibit 32.2
CERTIFICATION PURSUANT TO
18 U.S.C. SECTION 1350, AS ADOPTED PURSUANT TO SECTION 906 OF THE SARBANES-OXLEY ACT OF 2002
I, Charles J. Daley, Jr., the Executive Vice President, Chief Financial Officer and Treasurer of Artisan Partners Asset Management Inc. (the “Company”), hereby certify, pursuant to 18 U.S.C. Section 1350, as adopted pursuant to Section 906 of the Sarbanes-Oxley Act of 2002, that, to my knowledge:
• The Annual Report on Form 10-K of the Company for the annual period ended December 31, 2025 as filed with the Securities and Exchange Commission on the date hereof (the “Form 10-K”), fully complies with the requirements of Section 13(a) or 15(d) of the Securities Exchange Act of 1934, as amended; and
• The information contained in the Form 10-K fairly presents, in all material respects, the financial condition and results of operations of the Company.
| /s/ Charles J. Daley, Jr. | ||
Charles J. Daley, Jr. Executive Vice President, Chief Financial Officer and Treasurer (principal financial officer) | ||
Date: February 20, 2026